
Loading article…
| 米国の人口統計 | |
|---|---|
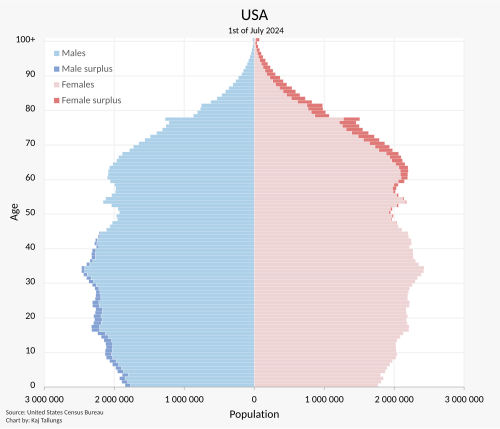 米国の人口ピラミッド | |
| 人口 |  335,893,238(2024年推定)[1] 335,893,238(2024年推定)[1] |
| 密度 | 86.16/平方マイル (33.27/km 2 ) |
| 成長率 | 0.67% (2024) [2] |
| 出生率 |  出生数10.7人/人口1,000人(2023年) 出生数10.7人/人口1,000人(2023年) |
| 死亡率 |  死亡者数9.2人/人口1,000人(2023年) 死亡者数9.2人/人口1,000人(2023年) |
| 平均寿命 | 79.3歳(2023年)[3] |
| • 男 | 76.9歳(2023年)[3] |
| • 女性 | 81.8歳(2023年)[3] |
| 出生率 | 1.84生まれ/女性(2024年)[2] |
| 乳児死亡率 | 死亡数5.4人/出生数1,000人(2020年)[4] |
| 純移住率 | 移民数3人/人口1,000人(2024年)[2] |
| 年齢構成 | |
| 18歳未満 | 22.2% (2021) [5] |
| 18~44歳 | 35.9% (2021) [5] |
| 45~64歳 | 25.2% (2021) [5] |
| 65歳以上 | 18.5%(2024年)[2] |
| 国籍 | |
| 国籍 | アメリカ人 |
| 主要民族 |
|
| 少数民族 |
|
| 言語 | |
| 正式 | 国家レベルで公用語はない。英語は50州のうち32州(および米国の5つの領土すべて)で公用語に指定されている。ハワイ語はハワイで公用語、20の先住民言語はアラスカで公用語、スー語はサウスダコタで公用語となっている。[13] サモア語はアメリカ領サモアで公用語、[14] チャモロ語はグアムで公用語、[15]チャモロ語とカロライニ語は北マリアナ諸島で公用語、[16]スペイン語はプエルトリコで公用語となっている。[17] |
| 話し言葉 |
|
| 出典:ワールドファクトブック[2] | |


国勢調査局によると、2024年1月1日現在のアメリカ合衆国の公式推定居住人口は3億3589万3238人である。[ 18 ]この数字には50州とワシントンDCが含まれるが、5つの非法人米国領土(プエルトリコ、グアム、米領バージン諸島、アメリカ領サモア、北マリアナ諸島)といくつかの小さな島嶼領有地の人口は含まれない。アメリカ合衆国は世界で3番目に人口の多い国であり、南北アメリカ大陸と西半球で最も人口の多い国である。[19]国勢調査局は、2022年7月までの12か月間の人口増加率が0.4%であると示しており、[20] 2021年の世界推計年間増加率1.03%を下回っています。[21]合計特殊出生率(TFR)は、2024年時点で女性1人あたり約1.84人で、[2]約2.1の置換出生率を下回っています。人種や民族的背景、宗教的所属、農村と都市の格差の割合など、いくつかの指標によると、イリノイ州は米国のより広い人口統計を最も代表しています。[22]
米国の人口は20世紀の間にほぼ4倍になり、年間約1.3%の成長率で、1900年の約7,600万人から2000年には2億8,100万人になった。 [23] 1967年には2億人の大台に達し、2006年10月17日には3億人の大台に達したと推定されている。 [23] [24]外国生まれの移民によって米国の人口は急増し続け、外国生まれの人口は1990年のほぼ2,000万人から2015年には4,500万人以上に倍増し、[25]人口増加の3分の1を占めている。[26]米国の人口は2018年から2019年にかけて160万人増加し、そのうち38%が移民によるものである。[27]人口増加は全体として少数民族の間で最も速く、国勢調査局の2020年の推計によると、米国の18歳未満の子供の50%は少数民族グループのメンバーです。[28] 2020年の時点で、白人は2億3541万1507人で、人口の71%を占めており、これには他の人種と組み合わせて白人であると自認する人々が含まれています。白人のみであると自認する人(ヒスパニック系白人を含む)は2億427万7273人で、人口の61.6%であり、非ラテン系白人は国の人口の57.8%を占めています。[29]
2010年から2020年までの国内総人口増加の51.1%はラテン系アメリカ人が占めた。 [30]ヒスパニック系またはラテン系の人口は、2010年の5050万人から2020年には6210万人に増加した。これは23%の増加であり、数的には1160万人以上の増加である。[30]移民と米国生まれのその子孫が、今後数十年間の米国の人口増加の大部分を占めると予想されている。[31]
アジア系アメリカ人はアメリカで最も急速に成長している人種グループであり、成長率は35%である。しかし、多民族のアジア系アメリカ人は、米国における混血結婚の増加を反映して、国内で最も急速に成長しているグループであり、成長率は55%である。[32] [33]
2022年現在[update]、白人アメリカ人の母親による出生は米国全体の約50%を占めており、2021年と比較して3%の減少を示しています。[34]同じ期間に、アジア系アメリカ人とヒスパニック系女性の出生はそれぞれ2%と6%増加しました。[35]
人口
2020年4月1日現在、アメリカ合衆国の人口は3億3,144万9,281人であると、2020年アメリカ合衆国国勢調査は発表している。[36]
注:海外軍隊を除いた米国の人口推計。[37] [38]

年齢と性別の分布


選択された年齢層別の年齢分布。[39]
- 0~14歳: 18.2%
- 15~24歳: 13.0%
- 25~54歳: 39.0%
- 55~64歳: 12.9%
- 65歳以上: 16.8%

2022年郡別平均年齢
46以上
43から45.9
39から42.9
35から39.9
34.9以下
2021年現在の総人口の平均年齢は38.8歳、男性の平均年齢は37.7歳、女性の平均年齢は39.8歳である。[ 39 ]
出生率
- 出生数12.023人/人口1,000人(2023年)[40]世界との比較:145位[2]
死亡率
- 死亡者数10.45人/人口1,000人(2021年推定)[41]世界との比較:72位[2]
- 8.81人死亡/1,000人(2021年推定)* [42] *年齢調整死亡率
合計特殊出生率(TFR)

合計特殊出生率(TFR)は2024年時点で女性1人あたり約1.84人である[2]
1800年には、平均的な米国の女性は7.04人の子供を産みましたが、[43] 1900年代の最初の10年までに、この数はすでに3.56にまで減少しました。[44] 1971年以降、出生率は一般的に2.1の置換率を下回っています。[45] [40] : 3 2007年の大不況以降、出生率は一貫して置換率を下回っています。[45] [40] : 3 2007年の女性1人あたり2.08から2017年の1.76への合計特殊出生率の低下は、主に少数民族、10代の若者、30代の女性の出生率の低下によるものでした。[46]その期間中、35歳から44歳の女性の出生率は上昇しました。[45] [46] 12か月間の一般出生率は、2021年第4四半期と比較して、2022年第1四半期には56.6から57.0に増加しました。[47]
初産時の母親の平均年齢

- 27.1歳(2020年推定)[48]
依存度比率

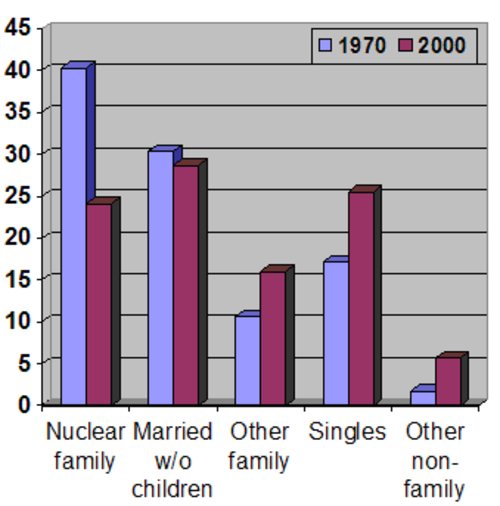
従属人口比率とは、通常労働力に属さない人々(0~14歳および65歳以上の従属人口)と、労働力に属す人々(15~64歳の生産年齢人口)の年齢人口比率です。生産年齢人口にかかる負担を測るために使用されます。扶養比率とは、生産年齢人口と高齢者人口の比率、つまり高齢者従属人口比率の逆数です。
- 総扶養率: 54.03% (2021) [39]世界との比較*: 110位[49]
- 児童扶養率: 28.11% (2021年) 世界との比較*: 138位
- 老年人口比率:25.92%(2021年) 世界との比較*:42位
- 潜在的支持率: 3.86 (2021) 世界との比較*: 160位
*比率は国別に最高から最低の順にランク付けされています。


平均寿命
- 総人口: 80.8歳 (2023年) [50] [51] 76.1歳 (2021年)、77.0歳 (2020年) [52]
- 男性:78.5歳(2023年)、[50] [51] 73.2歳(2021年)、74.2歳(2020年)
- 女性: 82.9歳 (2023年)、[50] [51] 79.9歳 (2021年)、79.9歳 (2020年)
米国の平均寿命は2014年以降低下している。疾病管理予防センターは、その主な理由として、過去10年間で過剰摂取が72%増加したこと( 2016年7月から2017年9月までのオピオイドの過剰摂取が30%増加したことを含むが、合法的な処方箋による偶発的な過剰摂取と、違法に入手したオピオイドやヘロイン、コカイン、メタンフェタミンなどの違法薬物と併用したオピオイドの過剰摂取を区別していない)、肝臓疾患が10年間で増加したこと(25歳から34歳の男性の割合は年間8%増加、女性の割合は年間11%増加)、 1999年以来の自殺率が33%増加したことの3つを挙げている。[53]
2019年から2020年にかけて、COVID-19パンデミックは米国の平均寿命の減少の約61%に寄与しました。[54]一方、不慮の事故、心臓病、殺人、糖尿病による死亡率の増加は、2019年から2020年にかけての平均寿命の減少のそれぞれ11.7%、5.8%、2.9%、2.8%に寄与しました。[54]平均寿命は人種や民族グループによっても異なり、非ヒスパニック系アジア人の平均寿命が最も長く、非ヒスパニック系アメリカインディアンの平均寿命が最も短いです。[54] 2021年、米国の出生時平均寿命は2年連続で低下し、1961~1963年以来初めて2年連続で低下しました。[55]
注:2021年の出生時平均寿命データは暫定的なものです。*
- NH = 非ヒスパニック。
- LEB = 出生時の平均寿命
- 成長矢印 ( / ) は、以前と比較した総平均寿命の増加または減少を示します。
生命表
密度
最も人口密度の高い州はニュージャージー州(1,263人/マイル2または488人/キロメートル2)です。
人口は高度に都市化しており、人口の83.3%が都市部や郊外に居住している。[2]大規模な都市クラスターは、米国東半分(特に五大湖周辺、北東部、東部、南東部)と西部諸州に広がっている。山岳地帯(主にロッキー山脈とアパラチア山脈)、南西部の砂漠、最北端の密集した北方林、中央草原諸州は人口密度が低い。アラスカの人口は南海岸沿いに集中しており(特にアンカレッジ市)、ハワイの人口はオアフ島に集中している。[2] カリフォルニア州とテキサス州は最も人口の多い州であり、米国の人口の中心地は一貫して西と南に移動している。[57] [58] ニューヨーク市は米国で最も人口の多い都市であり[59] 、少なくとも1790年以来その状態が続いている。
アメリカ合衆国領土における人口の中心地としては、プエルトリコのサンファン都市圏[60]、北マリアナ諸島のサイパン[61]、アメリカ領サモアのツツイラ島[62]などがある。
成長率
- 人口増加率: 0.12%。[39]世界との比較: 130位
人種別の出生数と出生率
2021年には合計3,659,289人の赤ちゃんが生まれ、2020年より1%増加した。さらに、研究者らは人種別出生数も調べたところ、白人女性とヒスパニック系女性の出生数はそれぞれ2020年から2021年にかけて約2%増加していることが判明した。一方、黒人女性とアジア人女性の出生数は同期間にそれぞれ2.4%と2.5%減少し、アメリカインディアン/アラスカ先住民の女性は3.2%減少した。[63]また、出生数が増加したのは2014年以来のことである。この報告書以前は、出生数は年間平均2%減少していた。[63]しかし、合計特殊出生率(平均的な女性が生涯に産む出産数)は女性1人あたり1.6635人であった。これは人口置換水準、つまり人口が自らを置き換えるために必要な水準、つまり少なくとも女性一人当たり2.1人の出生数をまだ下回っている。[63]
アメリカ生まれの人々
注:ヒスパニック系は民族と人種の両方でカウントされるため、全体の数は高くなります。また、成長矢印は出生率ではなく出生数の増減を示していることにも注意してください。[69] [70] [71] [72]
注記:
- NH = 非ヒスパニック。
- TFR = 合計特殊出生率(女性 1 人当たりの出生児数)。
- 増加矢印(/ )は、出生率ではなく、前年と比較した出生数の増減を示します。
2021年に米国州別に見た、ヒスパニック系以外の白人女性の8人目以降の子どもの出生率
ニューヨーク: 2.21%、ニュージャージー: 1.7%、ウィスコンシン: 1.04 %、アーカンソー: 1.02%、モンタナ: 0.86%、オハイオ: 0.85%、アイオワ: 0.84%、ペンシルベニア: 0.82%、カンザス: 0.76%、ケンタッキー: 0.76%、ユタ: 0.75%、ミネソタ: 0.75%、インディアナ: 0.72%、ワイオミング: 0.72%、ミシシッピ: 0.7%、ミシガン: 0.7%、アイダホ: 0.65%、ウェストバージニア: 0.64%、アリゾナ: 0.62%、ノースダコタ: 0.59%、サウスダコタ: 0.54%、アーカンソー0.51%、ニューメキシコ州: 0.50%、メリーランド州: 0.49%、オレゴン州: 0.46%、ミシガン州: 0.44%、オクラホマ州: 0.44%、フロリダ州: 0.43%、テネシー州: 0.42%、バージニア州: 0.41%、イリノイ州: 0.40%、ネバダ州: 0.40%、ウェストバージニア州: 0.39%、デラウェア州: 0.38%、ジョージア州: 0.36%、ネブラスカ州: 0.36%、テキサス州: 0.33%、アラバマ州: 0.33%、ミズーリ州: 0.32%、バーモント州: 0.31%、サウスカロライナ州: 0.30%、カリフォルニア州: 0.29%、コロラド州: 0.29%、ノースカロライナ州: 0.25%、アラスカ州: 0.25%、コネチカット州: 0.20%、ニューハンプシャー州: 0.19%、マサチューセッツ州: 0.17%。
移民(2023)


2017年、米国の外国生まれの人口のうち、約45%(2,070万人)が帰化市民、27%(1,230万人)が合法的な永住者(市民権取得資格を持つ人多数を含む)、6%(220万人)が一時的な合法的な居住者、23%(1,050万人)が不法移民であった。[76]現在米国に居住する移民のうち、出生国上位5か国は、メキシコ(移民の25%)、中国(6%)、インド(6%)、フィリピン(5%)、エルサルバドル(3%)である。現在居住する移民の約13%はヨーロッパとカナダから、10%はカリブ海諸国から来ている。[76] 2010年以降、新規到着者のうち、アジア系移民はヒスパニック系移民を上回っており、2017年には、到着した移民の37.4%がアジア系、26.6%がヒスパニック系であった。[76] 2017年と2018年まで、米国は数十年にわたって難民の再定住で世界をリードし、世界の他の国々を合わせたよりも多くの難民を受け入れていました。[77] 1980年度から2017年まで、難民の55%はアジアから、27%はヨーロッパから、13%はアフリカから、4%はラテンアメリカから戦争や迫害から逃れてきました。[77]
- 純移民率(2024年):人口1,000人あたり3人[2]世界との比較:38位[2]
- 純移民率*(2020-2021年):人口1,000人あたり0.73人[78]
*(年半ばの推定値)
2017年現在、人口の13.6%(4440万人)が外国生まれであり、1970年の4.7%からは増加しているが、1890年の記録である14.8%よりは低い。外国生まれの人口の45%は帰化した米国市民である。外国生まれのコミュニティの23%(1030万人)は不法滞在者であり、総人口の3.2%を占めている。[76] 2010年の国勢調査によると、ラテンアメリカとカリブ海地域が最大の出生地域グループであり、外国生まれの人口の53%を占めている。2018年現在、この地域は依然として米国への移民の最大の供給源となっている[79] [80] [81] 2018年には、米国には約9000万人の移民と米国生まれの移民の子供(第二世代のアメリカ人)がおり、米国全体の人口の28%を占めている。[82] 2018年には1,096,611人の移民が米国で永住権または一時的合法居住権を与えられた[83]
重要な統計
1935~2021年のアメリカ合衆国の出生数、死亡数、自然増加数

米国国勢調査局によると、2021年の米国の人口増加率は、建国以来最も低かった。[87]米国の人口は前年比でわずか0.1%増加した。[87]米国の人口増加率が1937年以来初めて100万人を下回ったが、これは国勢調査局が毎年の人口推計を始めた1900年以降で最も低い数値の増加となった。[87]人口増加率が歴史的に低い水準に急落した過去数年間を除けば、20世紀で最も増加率が低かったのは、インフルエンザの大流行と第一次世界大戦が本格化した1918年から1919年の間であった。[87]米国では、出生率の低下と国際純移民、高齢化による死亡率の上昇により、ここ数年間、人口増加率の鈍化が常態化している。[87]
言い換えれば、2010年代半ば以降、出生数と国際純移民数は減少し、死亡数は増加している。これらの傾向は、人口増加の減少という累積的な影響を及ぼしている。[87]
COVID -19パンデミックによりこの傾向は加速し、2021年の人口増加は歴史的に緩やかなものとなりました。
2021年の成長率は0.1%と推定されている。[87]
出生率は2020年時点で人口1,000人あたり11.0人である。[48]これは記録が始まって以来の最低の出生率であった。2020年の出生数は3,613,647人で、1980年以来の最低の出生数であった。[48]
- 年間出生数11.0人/人口1,000人(2020年確定値)。
- 年間1,000人あたり11.4人の出生数(2019年の最終データ)。[48]
2020年、CDCは2020年の結婚件数が1,676,911件だったと報告したが、2019年には2,015,603件だった。[88]結婚率は州によって大きく異なり、カリフォルニア州の人口1,000人あたり3.2件からネバダ州の人口1,000人あたり21.0件までの範囲であった。* [89]
- 年間5.1件の結婚/人口1,000人(2020年の暫定データ)。[88]
- 年間6.1件の結婚/人口1,000人(2019年の暫定データ)。[88]
*割合は、州別の暫定的な結婚数に基づいています
2009年、タイム誌は、出産の40%が未婚女性によるものだと報じた。[90]以下は未婚出産の人種別の内訳である:アジア人17%、白人29%、ヒスパニック系(全人種)53%、ネイティブアメリカン66%、黒人アメリカ人72%。[91]
CDCによると、2020年には少なくとも1,461,121人の未婚女性の出生がありました。2020年の出生の40.5%は未婚女性によるものでした。未婚出生の人種別の内訳は次のとおりです:非ヒスパニック系白人28.4%、非ヒスパニック系黒人70.4%、ヒスパニック系(全人種)52.8%。[92]
2007年から2009年にかけての出生率の低下は、大不況と関連していると考えられている。[93]
英国医療研究品質局(AHRQ)の調査によると、2008年と2011年に病院で生まれた子どもの半数以上(51%)が男児だった。[94]
2011年3月に発表された米国連邦政府のデータによると、出生数は2007年から2009年にかけて4%減少し、これは1970年代以降で最大の2年間の減少となった。[ 95] 出生数は3年連続で減少しており、現在は2007年のピークから7%下回っている。[96]米国立健康統計センターが2011年6月に発表したデータによると、この減少は2010年も続いている。[96]多くの専門家は、この減少は主に不利な経済状況を反映していると示唆している。[97]出生率と景気後退のこの関連性は、アメリカの出生率が1930年代の大恐慌に匹敵するレベルにまで低下しているという事実に部分的に起因している。[98]アメリカの10代の出生率はアメリカ史上最低水準にある。[99]実際、米国の10代の出生率は、2005年から2007年までの短い増加を除いて、1991年から2011年まで一貫して減少しています。 [99 ] 10代の出生率が着実に減少している中でのもう1つの異常な点は、2008年から2009年の間に15歳から19歳の出生率が6%減少したことです。 [99]これらの減少年にもかかわらず、米国の10代の出生率は他の先進国よりも依然として高いです。[99] 10代の出生率と妊娠率にも人種差が見られます。アメリカインディアン/アラスカ先住民、ヒスパニック、非ヒスパニックの黒人の10代の妊娠率は、非ヒスパニックの白人の10代の出生率の2倍以上です。[100]
米国の人口統計表、1935~2023年
[101] [37] [38]
p = 暫定データ
現在の人口動態統計
[117]
このセクションの現在の数値はすべて暫定的なものであり、今後の更新によって変更される可能性があります。詳細については、参照リンクを参照してください。
州別の合計特殊出生率
米国の人口予測表
米国国勢調査局の 2017 年の予測は、コーホート コンポーネント法を使用して作成されました。コーホート コンポーネント法では、人口変化のコンポーネント (出生率、死亡率、純移民) が、出生コーホート (特定の年に生まれた人) ごとに個別に予測されます。ベース人口は、予測される生存率と純国際移民を使用して毎年増加します。毎年、予測される出生率を女性人口に適用することで、新しい出生コーホートが人口に追加されます。
1790年以来
1900年、米国の人口が7600万人だったとき、米国には6680万人の白人アメリカ人がおり、全人口の88%を占めていました。[124]黒人アメリカ人は880万人で、そのうち約90%がまだ南部諸州に住んでいました。[125]そして、ヒスパニック系は50万人強でした。[126]
1965年の移民国籍法に基づき、[127]米国に住む第一世代の移民の数は増加しており、[128] 1970年の960万人から2007年には約3800万人に増加しています。 [129] 1990年代には年間約100万人が合法的に米国に移住しており、1950年代の年間25万人から増加しています。[130]
1900年には、非ヒスパニック系白人が米国の10大都市の人口のほぼ97%を占めていた。 [ 131]国勢調査局は、2010年7月から2011年7月の間に米国で生まれた子供の50.4%を少数民族(ヒスパニック系白人を含む)が占めていると報告した。[132] 1990年には37%であった。[133]
2014年、出生率が最も低かったのはロードアイランド州で1.56、最も高かったのはユタ州で2.33だった。[69]これは各州の人口の年齢と相関関係があり、ロードアイランド州の平均年齢は米国で9番目に高く39.2歳であるのに対し、ユタ州は最も低く29.0歳となっている。[134]
2017年の米国の出生率は、人口減少を経験しないために女性1人あたり少なくとも2.1人の子供が必要な置換レベルを大きく下回ったままであり、全50州とコロンビア特別区で白人の出生数が減少した。非ヒスパニック系白人女性では、出生率が置換レベルを超えた州はなかった。非ヒスパニック系黒人女性では、12州が必要な置換レベルを超えた。ヒスパニック系女性では、29州が上回った。[135]非ヒスパニック系白人女性の場合、合計特殊出生率が最も高かったのはユタ州で2.099、最も低かったのはコロンビア特別区で1.012であった。非ヒスパニック系黒人女性の場合、合計特殊出生率が最も高かったのはメイン州で4.003、最も低かったのはワイオミング州で1.146であった。ヒスパニック系女性の合計特殊出生率は、アラバマ州が3.085で最も高く、バーモント州が1.200、メイン州が1.281で最も低かった。[135] [136]白人の高齢化と出生率の低下により、現在、国内の半数以上の州で白人(非ヒスパニック系)の死亡数が出生数を上回っている。[137]
2018年、米国の出生数は32年ぶりの最低水準に落ち込んだ。[138]
人口の平均年齢
歴史を通じた米国の人口の平均年齢。出典:米国商務省、国勢調査局、米国国勢調査局、ワールドファクトブック。[104] [139]
重要な統計

-2.00%以下
-0.01% から -1.99%
0%から0.99%
1%から2.49%
2.5%から4.99%
5%から8.99%
9%から11.99%
12%以上

2020年現在の米国の合計特殊出生率は1.641である[48]
- 非ヒスパニック系白人の場合1.55 [48]
- 非ヒスパニック系黒人の場合1.71 [48]
- ネイティブアメリカン(ヒスパニックを含む)の場合 1.65
- アジア系アメリカ人(ヒスパニック系を含む)の場合 1.53
その他: [69]
- ヒスパニック(全人種)1.88 [48]
( CDC では、ヒスパニックの約 95% が「白人ヒスパニック」として含まれており、国勢調査の「その他の人種」カテゴリを認識しておらず、そのカテゴリの人々を白人としてカウントしていることに 注意してください。)
出典: 2010年米国国勢調査データに基づく国家重要統計報告書[141]
1800年から2020年までの合計特殊出生率
合計特殊出生率とは、女性一人当たりの出生児数である。出典:アンスリー・J・コール、ゼルニック、国立健康統計センター[142]
1901年から2015年までの平均寿命
1901年から2015年までの米国の平均寿命。出典: Our World In Dataおよび国連。
1901–1950
1901–2015
出典:国連世界人口見通し[145]
年齢別の総人口の割合: 1900年から2015年
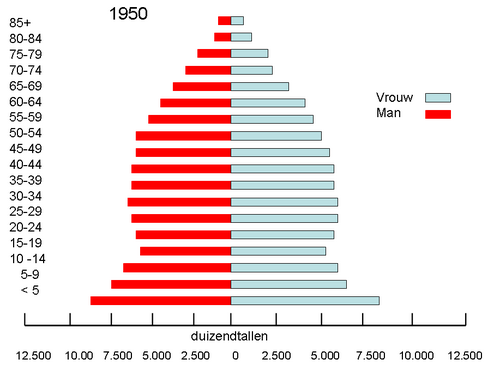
出典:米国国勢調査局、米国商務省、国連中位推計[146] [147]
人口密集地
アメリカには数十の大都市があり、その中にはあらゆる種類の「グローバル都市」[148]が31あり、そのうち10都市はグローバル都市の「アルファ」グループに属し、ニューヨーク、ロサンゼルス、シカゴ、ワシントンDC、ボストン、サンフランシスコ、マイアミ、フィラデルフィア、ダラス、アトランタとなっている。[149] 2021年現在[update]、アメリカには100万人以上の住民を抱える大都市圏が56ある。(米国国勢調査局は、ホノルル都市圏を人口100万人強で56番目に人口の多い地域にランク付けしている。米国の大都市統計地域の表を参照。)
2011年現在[update]、約2億5000万人のアメリカ人が都市部またはその周辺に住んでいます。つまり、米国の人口の4分の3以上が米国の国土面積の約3%を占めていることになります。[150]
次の表は、上位 20 の都市圏の人口を示しています。
人種と民族

- ヒスパニック系および非ヒスパニック系の人種グループ(2020年国勢調査)
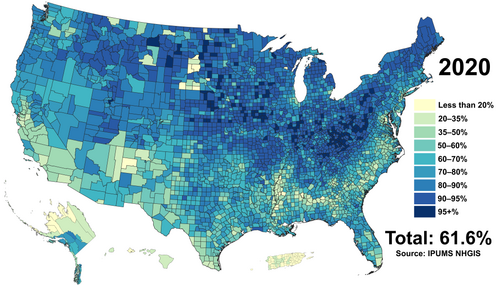
アメリカ合衆国の人種グループ(2020年国勢調査)ヒスパニックの人種的識別を含む[155]
白人アメリカ人(61.6%)
黒人アメリカ人(12.4%)
2つ以上の人種(10.2%)
その他の人種(8.4%)
アジア系アメリカ人(6.0%)
ネイティブアメリカン(1.1%)
太平洋諸島系アメリカ人(0.2%)
アメリカ合衆国の人種と民族グループ(2020年国勢調査)[156]
白人アメリカ人* (57.8%)
ヒスパニック系アメリカ人** (18.7%)
黒人アメリカ人* (12.1%)
アジア系アメリカ人* (5.9%)
2つ以上の人種*(4.1%)
ネイティブアメリカン* (0.7%)
その他の人種* (0.5%)
太平洋諸島系アメリカ人* (0.2%)
* NHL
** OAR


人種

米国国勢調査局は、米国行政管理予算局(OMB)のガイドラインに従って人種データを収集しており、これらのデータは自己認識に基づいています。他の多くの国では、出身地に基づいて複数の人種を数えますが、アメリカでは数十の民族グループを肌の色でグループ化しています。[158]米国国勢調査局が使用する人種の分類と定義は次のとおりです。[159]
- 白人: ヨーロッパ、中東、北アフリカの先住民族のいずれかに起源を持つ人。[160]これには、人種を「白人」と示す人や、イギリス人、イラン人(アゼルバイジャン人、クルド人、ルール人)、アイルランド人、ドイツ人、イタリア人、スペイン人、ポルトガル人、レバノン人、アラブ人、モロッコ人、コーカサス人などの項目を報告する人が含まれます。
- 黒人またはアフリカ系アメリカ人: アフリカの黒人人種グループのいずれかに起源を持つ人。[160]これには、自分の人種を「黒人、アフリカ系アメリカ人」と示す人や、アフリカ系アメリカ人、ケニア人、ナイジェリア人、ハイチ人などの項目を報告する人が含まれます。
- アメリカインディアンまたはアラスカ先住民: 南北アメリカ(中央アメリカを含む)の先住民族のいずれかに起源を持ち、部族やコミュニティへの所属を維持している人。[160]このカテゴリには、人種を「アメリカインディアンまたはアラスカ先住民」と示す人、またはナバホ族、ブラックフット族、イヌピアット族、ユピック族、中央アメリカインディアングループ、南アメリカインディアングループなどの項目を報告する人が含まれます。
- アジア人:東アジア、東南アジア、インド亜大陸の先住民族のいずれかに起源を持つ人。例えば、バングラデシュ、カンボジア、中国、インド、日本、マレーシア、パキスタン、フィリピン、韓国、台湾、タイ、ベトナムなど。[ 160]
- ネイティブハワイアンまたはその他の太平洋諸島民:ハワイ、グアム、サモア、またはその他の太平洋諸島の先住民族のいずれかに起源を持つ人。[160]
- その他の人種: 上記の「白人」、「黒人またはアフリカ系アメリカ人」、「アメリカインディアンまたはアラスカ先住民」、「アジア人」、「ハワイ先住民またはその他の太平洋諸島民」の人種カテゴリに含まれないその他のすべての回答が含まれます。これには、西アジアまたはロシア (ヨーロッパ以外のロシア) のアジア人、および白人アフリカ人が含まれます。
- 2 つ以上の人種: 2 つ以上の人種の回答チェックボックスをオンにするか、複数の回答を入力するか、チェックボックスと他の回答を組み合わせることで、2 つ以上の人種を選択できます。
人種と民族に関するデータは国勢調査局に自己申告される。2000年の国勢調査以来、議会は人々が複数のカテゴリーを選択することで、複数の人種分類に従って自分自身を特定することを許可している。しかし、選択できる民族は1つだけである。国勢調査局は「ヒスパニックまたはラテン系」と「ヒスパニックでもラテン系でもない」の2つの民族しか認めていないためである。この2つは相互に排他的であり、どちらか一方であることはできるが、両方であることはできない。連邦政府が認める民族として、ヒスパニックという単数形は、人種に関係なく、キューバ人、メキシコ人、プエルトリコ人、キューバ人、南米人、中米人、またはその他のスペイン文化または起源を持つ人と国勢調査局が定義する複合的な「ヒスパニックまたはラテン系」に取って代わられた。[161]
国勢調査局のウェブサイトによると、2021年のアメリカ合衆国の人種構成は次の通りである。[162]
2022年のアメリカコミュニティ調査によると、2022年のアメリカの人種構成は次の通りである。[163] [164]
- アメリカ合衆国の人種グループ(同一人種)
-
-
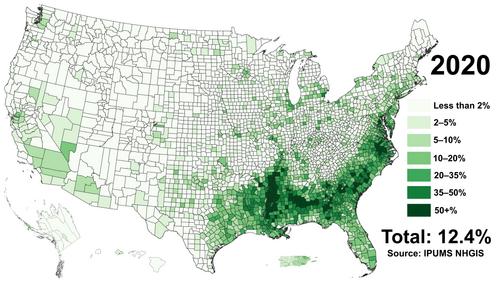
-
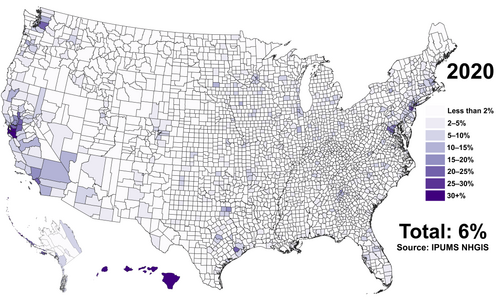
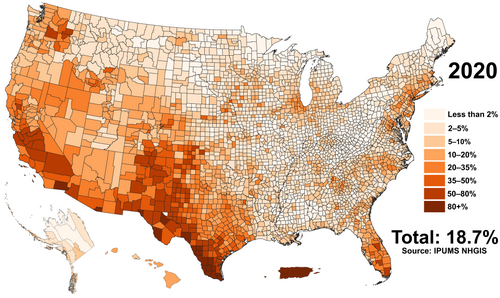
- 民族グループにおける米国
-

-
- 1900年から2020年までの人種別総人口分布(%)
ヒスパニックは人種の一部として示されている。出典:米国国勢調査局。[146] [139]
*データは、白人、黒人またはアフリカ系アメリカ人、アメリカインディアンおよびアラスカ先住民、アジア人およびハワイ先住民およびその他の太平洋諸島民、およびその他の人種のみの人口について表示されます。
- 2021 年の各人種と民族別の平均年齢
出典:アメリカ合衆国国勢調査局[165]
- 2021 年の人種単独または人種と民族の組み合わせによる平均年齢
出典:アメリカ合衆国国勢調査局[165]
ヒスパニック系またはラテン系

米国行政管理予算局(OMB)は、「ヒスパニックまたはラテン系」を、人種に関係なく、キューバ、メキシコ、プエルトリコ、ドミニカ、南米、中米、またはその他のスペイン文化または起源を持つ人と定義しています。「ヒスパニック」または「ラテン系」という用語に自分を当てはめる人は、10年ごとの国勢調査質問票や国勢調査局のさまざまな調査質問票に記載されている特定のヒスパニックまたはラテン系のカテゴリ(「メキシコ、メキシコ系アメリカ人、チカーノ」または「プエルトリコ」または「キューバ」)のいずれかに自分を分類する人、および「その他のヒスパニック、ラテン系、またはスペイン起源」であると示す人です。[175]ヒスパニックまたはラテン系を起源と見なす人は、どの人種でもかまいません。[159]
- 1970~2020年のヒスパニック系人口分布(%)
出典:米国国勢調査局、10年ごとの人口調査、1970年(5パーセントサンプル)、1980年から2020年。[139]
- 2021 年の各人種の平均年齢(ヒスパニック)
出典:アメリカ合衆国国勢調査局[165]
- 2021 年の各人種単独または組み合わせの平均年齢(ヒスパニック)
出典:アメリカ合衆国国勢調査局[165]
注: ヒスパニック系の出身は人種ではなく民族とみなされます。ヒスパニック系の人種は問いません。
先住民族
2020年現在、アメリカ合衆国にはアメリカインディアンおよびアラスカ先住民と自認する人々が9,666,058人おり、これには複数の人種を自認する人々も含まれ、 [176]アメリカ合衆国人口の約3%を占めている。この数には、アメリカ合衆国の先住民グループだけでなく、アメリカ大陸のあらゆる先住民族[177] 、マヤ人などのメソアメリカの人々、カナダ人および南米の先住民族も含まれる。2022年には、アメリカ合衆国の先住民のうち634,503人が中米先住民グループに属し、875,183人がメキシコ先住民に属し、47,518人がカナダ先住民に属していた。[178] 2022年にアメリカインディアンまたはアラスカ先住民であると自認した320万人のアメリカ人のうち、約45%がヒスパニックまたはラテン系の民族であり、[179] [180]ラテンアメリカ諸国からの先住民の米国への移住者数が増加し、より多くのラテン系が先住民の伝統を自認するにつれて、この数が増加しています。アメリカ合衆国本土の先住民グループのうち、自認部族が最も多いのは、チェロキー(1,449,888)、ナバホ(434,910)、チョクトー(295,373)、ブラックフット(288,255)、スー(220,739)です。さらに、205,954人がアラスカ先住民の部族に属していると考えています。米国には、連邦政府に認定された573の部族政府があります[181] 。 [182]
米国国勢調査局は、ハワイ先住民をアメリカインディアンやアラスカ先住民とは別に分類し、太平洋諸島民と同じグループにまとめている。2022年の推計によると、714,847人のアメリカ人がハワイ先住民の祖先であると自認している。[183]
その他のグループ
2022年には1610万人の退役軍人がおり[184]、軍隊に勤務したことがあるアメリカ人はわずか6.2%でした。[185]
2010年、ワシントンポスト紙は、米国には1100万人の不法移民がいると推定した。[186] 2017年現在、ピュー研究所は、米国には推定1050万人の不法移民がいると報告している[187]
2022年には、米国で推定1,849,176人の成人が投獄された。[188]
予測
米国国勢調査局の報告書では、2023年から2060年の間に非ヒスパニック系白人の割合が58.9%から44.9%に減少すると予測されている。非ヒスパニック系白人は2050年までに人口の過半数を占めなくなると予測されているが、最大の民族グループであり続けるだろう。1960年には非ヒスパニック系白人は人口の85%を占めていた。[190]
非ヒスパニック系白人は少数派になると予測されているが、白人人口全体(ヒスパニック系を含む)は2023年から2060年まで多数派であり続け、予測によると、白人のみの人口は75.5%から72.3%に減少する。[191]しかし、これらの予測は、国勢調査で使用される「その他の人種」カテゴリーを含まない修正された人種データセットに基づいているため、国勢調査局の他のデータと直接比較することはできない。[192] 「その他の人種」を単独または組み合わせて特定する個人は、2022年の人口の16.2%を占め、[194] 予測に使用されるデータセットで認識されている人種カテゴリーに再分類されている。[195]その結果、2023年の予測による白人単独人口の割合(75.5%)と、2022年のアメリカコミュニティ調査で報告された白人単独人口の推定割合(60.9%)との間には大きな乖離がある。[196]
報告書では、ヒスパニック系またはラテン系の人口が現在の19.1%から2060年までに26.9%に増加し、黒人の割合が13.6%から14.8%にわずかに増加し、アジア系アメリカ人が6.3%から9.4%に増加すると予測されています。米国の人口は2023年7月時点で3億3,300万人で、2040年には3億5,500万人、2060年には3億6,400万人に達すると予測されています。 [197] [198] [199] [200] [201]さらに、2023年から2060年までの人口増加はすべて移民によるものと予測されています。
2060年の米国の子供のうち、64%が少数民族になると予想されており、これは現在の51%から増加する。約32%がヒスパニック系またはラテン系になると予測されており(2023年の26%から増加)、36%が単一人種の非ヒスパニック系白人になると予測されている(2023年の49%から減少)。人種的および民族的マイノリティは、2015年に非ヒスパニック系白人を上回り、米国の5歳未満の子供の最大のグループとなった。[202]
アメリカで最も急速に成長している人種グループはアジア系アメリカ人で、成長率は35%ですが、多民族の混血アジア人グループはさらに急速に成長しており、成長率は55%です。したがって、多民族のアジア人はアメリカで最も急速に成長している人口グループです。[33] [32]
2020年には、出生の51.0%が非ヒスパニック系白人母親によるものだったと報告されている。[141] 2021年には、その割合は51.5%に増加した。[141] [203]しかし、2022年までに白人母親による出生率は3%減少し、全出生数の50%にまで落ち込んだ。同じ期間に、アジア系女性とヒスパニック系女性の出生率はそれぞれ2%と6%増加した。[35] [34]
- 人種グループの人口ピラミッド(1つの人種)
-

-

-

-

-

- 民族集団の人口ピラミッド
-

-
 非ヒスパニック系アフリカ系アメリカ人
 -

- ピュー研究所の予測
国連は2060年の人口が4億人を超えると予測している。[204]
この国の人種構成は大きく変わり、白人は米国で最大の民族グループであり続けるものの、ピュー研究所によると、2055年までに白人ヒスパニックを除いて多数派ではなくなる。ヒスパニックとアジア人の人口は今後40年間でほぼ3倍に増加すると予測されている。2055年までに、その内訳は非ヒスパニック系白人48%、ヒスパニック24%、黒人16%、アジア人14%になると推定されている。[204]
2015年現在[update]、米国の人口の14%は外国生まれであるが、1965年にはわずか5%であった。1965年以降、約3,900万人の移民が米国にやって来ており、そのほとんどはアジアとラテンアメリカから来ている。2015年の国勢調査報告書では、米国の人口に占める外国生まれの割合は増加し続け、2060年までに19%に達すると予測されている。この外国生まれの人口の増加は、全体の人口増加の大部分を占めることになる。[204]
2060年の米国の平均年齢は、現在の2018年の平均年齢よりも高くなる可能性が高く、4人に1人が65歳以上になると予測されています。[204]
米国国勢調査局の予測
- 1970~2042年の少数民族の割合(2008年予測)
- [139]
注: 「マイノリティ」とは、10 年ごとの国勢調査で、民族および人種を非ヒスパニック系白人以外として報告した人々を指します。
- 米国の総人口
Self-reported ancestry

This table displays all self-reported ancestries with over 50,000 members, alone or in combination, according to estimates from the 2022 American Community Survey. The total population of the US according to the survey was 333,287,550, and 251,732,240 people reported an ancestry. Of these, 175,054,020 reported a single ancestry, and 76,678,224 reported two or more ancestries.[207] Hispanic groups are not distinguished between total and partial ancestry:
Religion
Religious affiliations
Religion in the United States (2023)[213]
Protestantism (41%)
Catholicism (18%)
Other Christian (2%)
Unaffiliated (31%)
Jewish (2%)
Muslim (1%)
Buddhist (1%)
Hindu (1%)
Other religion (2%)
The table below is based mainly on selected data as reported to the United States Census Bureau. It only includes the voluntary self-reported membership of religious bodies with 750,000 or more. The definition of a member is determined by each religious body.[214] In 2004[update], the US census bureau reported that about 13% of the population did not identify themselves as a member of any religion.[215][clarification needed]
In a Pew Research Survey performed in 2012, Americans without a religion (atheists, agnostics, nothing in particular, etc.) approached the numbers of Evangelical Protestant Americans with almost 20% of Americans being nonreligious (compared to just over 26% being Evangelical Protestant). If this current growth rate continues, by 2050, around 51% of Americans will not have a religion.[216]
Surveys conducted in 2014 and 2019 by Pew indicated that the percentage of Americans unaffiliated with a religion increased from 16% in 2007 to 23% in 2014 and 26% of the population in 2019.[217][218]
According to statistical data made by the Pew Research Center in 2021 about 63% of the US population is Christian, 28% is Unaffiliated, 2% is Jewish, 1% follows Buddhism, 1% follows Hinduism, 1% follows Islam and 2% follow traditional religions and others. Currently, the United States has the largest Christian population in the world (approximately 230-250 million) and the largest Protestant Christian population (approximately 150-160 million). The country also has the second largest Jewish community in the world (after Israel) and the largest Buddhist and Hindu communities in the West, as well as the largest number of followers of Islam in North America. The country has about 64 million non-affiliates (only China and Japan have more).[citation needed][219]
-
 Religious affiliation within each state that has the largest deviation compared to the national average, 2001
 -
 Percentage of state populations that identify with a religion rather than "no religion", 2014
 -
 Plurality religion by state, 2001. Data is unavailable for Alaska and Hawaii.

According to Pew Research Center study released in 2018, by 2040, Islam will surpass Judaism to become the second largest religion in the US due to higher immigration and birth rates.[245]
Religions of U.S. adults
The United States government does not collect religious data in its census. The survey below, the American Religious Identification Survey (ARIS) 2008, was a random digit-dialed telephone survey of 54,461 American residential households in the contiguous United States. The 1990 sample size was 113,723; 2001 sample size was 50,281.
Adult respondents were asked the open-ended question, "What is your religion, if any?". Interviewers did not prompt or offer a suggested list of potential answers. The religion of the spouse or partner was also asked. If the initial answer was "Protestant" or "Christian" further questions were asked to probe which particular denomination. About one-third of the sample was asked more detailed demographic questions.
Religious Self-Identification of the U.S. Adult Population: 1990, 2001, 2008[246]
Figures are not adjusted for refusals to reply; investigators suspect refusals are possibly more representative of "no religion" than any other group.
-
![States in the United States by Catholic population according to the Pew Research Center 2014 Religious Landscape Survey.[247] States with Catholic population greater than the United States as a whole are in full red.](https://img-server.japedia.wiki/wikipedia/commons/thumb/c/ca/US_states_by_Catholic_population.png/500px-US_states_by_Catholic_population.png) States in the United States by Catholic population according to the Pew Research Center 2014 Religious Landscape Survey.[247] States with Catholic population greater than the United States as a whole are in full red.
States in the United States by Catholic population according to the Pew Research Center 2014 Religious Landscape Survey.[247] States with Catholic population greater than the United States as a whole are in full red. -
![States in the United States by Evangelical Protestant population according to the Pew Research Center 2014 Religious Landscape Survey.[247] States with Evangelical Protestant populations greater than the United States as a whole are in full orange.](https://img-server.japedia.wiki/wikipedia/commons/thumb/7/7d/US_states_by_Evangelical_Protestant_population.png/500px-US_states_by_Evangelical_Protestant_population.png) States in the United States by Evangelical Protestant population according to the Pew Research Center 2014 Religious Landscape Survey.[247] States with Evangelical Protestant populations greater than the United States as a whole are in full orange.
States in the United States by Evangelical Protestant population according to the Pew Research Center 2014 Religious Landscape Survey.[247] States with Evangelical Protestant populations greater than the United States as a whole are in full orange.
-
![States in the United States by Mainline or Black Protestant population according to the Pew Research Center 2014 Religious Landscape Survey.[247] States with Mainline or Black Protestant population greater than the United States as a whole are in full purple.](https://img-server.japedia.wiki/wikipedia/commons/thumb/f/f6/US_states_by_Mainline_or_Black_Protestant_population.png/500px-US_states_by_Mainline_or_Black_Protestant_population.png) States in the United States by Mainline or Black Protestant population according to the Pew Research Center 2014 Religious Landscape Survey.[247] States with Mainline or Black Protestant population greater than the United States as a whole are in full purple.
States in the United States by Mainline or Black Protestant population according to the Pew Research Center 2014 Religious Landscape Survey.[247] States with Mainline or Black Protestant population greater than the United States as a whole are in full purple. -
![States in the United States by non-Christian (e.g. Non-religious, Jewish, Muslim, Hindu, Buddhist) population according to the Pew Research Center 2014 Religious Landscape Survey.[247] States with non-Christian populations greater than the United States as a whole are in full blue.](https://img-server.japedia.wiki/wikipedia/commons/thumb/5/53/US_states_by_non-Christian_population.png/500px-US_states_by_non-Christian_population.png) States in the United States by non-Christian (e.g. Non-religious, Jewish, Muslim, Hindu, Buddhist) population according to the Pew Research Center 2014 Religious Landscape Survey.[247] States with non-Christian populations greater than the United States as a whole are in full blue.
States in the United States by non-Christian (e.g. Non-religious, Jewish, Muslim, Hindu, Buddhist) population according to the Pew Research Center 2014 Religious Landscape Survey.[247] States with non-Christian populations greater than the United States as a whole are in full blue.
-
![States in the United States by non-Protestant and non-Catholic Christian (e.g. Mormon, Jehovah's Witness, Eastern Orthodox) population according to the Pew Research Center 2014 Religious Landscape Survey.[247] States with non-Catholic/non-Protestant Christian population greater than the United States as a whole are in full green.](https://img-server.japedia.wiki/wikipedia/commons/thumb/5/55/US_states_by_other_Christian_population.png/500px-US_states_by_other_Christian_population.png) States in the United States by non-Protestant and non-Catholic Christian (e.g. Mormon, Jehovah's Witness, Eastern Orthodox) population according to the Pew Research Center 2014 Religious Landscape Survey.[247] States with non-Catholic/non-Protestant Christian population greater than the United States as a whole are in full green.
States in the United States by non-Protestant and non-Catholic Christian (e.g. Mormon, Jehovah's Witness, Eastern Orthodox) population according to the Pew Research Center 2014 Religious Landscape Survey.[247] States with non-Catholic/non-Protestant Christian population greater than the United States as a whole are in full green.
LGBT population
The 2000 U.S. Census counted same-sex couples in an oblique way; asking the sex and the relationship to the "main householder", whose sex was also asked. Community Marketing & Insights, an organization specializing in analyzing gay demographic data, reported, based on this count in the 2000 census and in the 2000 supplementary survey, that same-sex couples comprised between 1.0% and 1.1% of U.S. couples in 2000.[248] A 2006 report issued by The Williams Institute on Sexual Orientation concluded that the number of same-sex couples in the U.S. grew from 2000 to 2005, from nearly 600,000 couples in 2000 to almost 777,000 in 2005.[249] A 2006 UCLA study reported that 4.1% of Americans aged 18–45 identify as gay, lesbian, or bisexual.[250]
A 2011 report by the Williams Institute estimated that nine million adults identify as gay, lesbian, or bisexual, representing 3.5% of the population over 18.[251] A spokesperson said that, until recently, few studies have tried to distinguish people who had occasionally undertaken homosexual behavior or entertained homosexual thoughts, from people who identified as lesbian or gay.[252] (Older estimates have varied depending on methodology and timing; see Demographics of sexual orientation for a list of studies.)
Foreign-born population
As of 2017, an estimated 44,525,458 residents of the United States were foreign-born,[253] 13.5% of the country's total population. This demographic includes recent as well as longstanding immigrants; statistically Europeans have resided in the US longer than those from other regions with approximately 66% having arrived prior to 2000.[254]
Citizens living abroad
As of April 2015, the U.S. State Department estimated that 8.7 million American citizens live overseas. Americans living abroad are not counted in the U.S. Census unless they are federal government employees or dependents of a federal employee.[255] A 2010 paper estimated the number of civilian Americans living abroad to be around 4 million.[256] So-called "accidental Americans" are citizens of a country other than the United States who may also be considered U.S. citizens or be eligible for U.S. citizenship under specific laws but are not aware of having such status (or became aware of it only recently).[257]
As of 2022, 1.6 million U.S. Americans live in Mexico, according to the State Department.[258]
Economics
Income
In 2020, the median household income in the United States was around $67,521, 2.9 percent less than the 2019 median of $69,560.[259] Household and personal income depends on variables such as race, number of income earners, educational attainment and marital status.
-
![Counties in the United States by the percentage of the over 25-year-old population with bachelor's degrees according to the U.S. Census Bureau American Community Survey 2013–2017 5-Year Estimates.[263] Counties with higher percentages of bachelor's degrees than the United States as a whole are in full orange.](https://img-server.japedia.wiki/wikipedia/commons/thumb/1/18/US_counties_by_percentage_BAs.png/500px-US_counties_by_percentage_BAs.png) Counties in the United States by the percentage of the over 25-year-old population with bachelor's degrees according to the U.S. Census Bureau American Community Survey 2013–2017 5-Year Estimates.[263] Counties with higher percentages of bachelor's degrees than the United States as a whole are in full orange.
Counties in the United States by the percentage of the over 25-year-old population with bachelor's degrees according to the U.S. Census Bureau American Community Survey 2013–2017 5-Year Estimates.[263] Counties with higher percentages of bachelor's degrees than the United States as a whole are in full orange. -
![States in the United States by the percentage of the over 25-year-old population with bachelor's degrees according to the U.S. Census Bureau American Community Survey 2013–2017 5-Year Estimates.[263] States with higher percentages of bachelor's degrees than the United States as a whole are in full orange.](https://img-server.japedia.wiki/wikipedia/commons/thumb/5/5b/US_states_by_percentage_BAs.png/500px-US_states_by_percentage_BAs.png) States in the United States by the percentage of the over 25-year-old population with bachelor's degrees according to the U.S. Census Bureau American Community Survey 2013–2017 5-Year Estimates.[263] States with higher percentages of bachelor's degrees than the United States as a whole are in full orange.
States in the United States by the percentage of the over 25-year-old population with bachelor's degrees according to the U.S. Census Bureau American Community Survey 2013–2017 5-Year Estimates.[263] States with higher percentages of bachelor's degrees than the United States as a whole are in full orange.
-
![Counties in the United States by per capita income according to the U.S. Census Bureau American Community Survey 2013–2017 5-Year Estimates.[264] Counties with per capita incomes higher than the United States as a whole are in full green.](https://img-server.japedia.wiki/wikipedia/commons/thumb/7/7e/US_counties_by_per_capita_income.png/500px-US_counties_by_per_capita_income.png) Counties in the United States by per capita income according to the U.S. Census Bureau American Community Survey 2013–2017 5-Year Estimates.[264] Counties with per capita incomes higher than the United States as a whole are in full green.
Counties in the United States by per capita income according to the U.S. Census Bureau American Community Survey 2013–2017 5-Year Estimates.[264] Counties with per capita incomes higher than the United States as a whole are in full green. -
![States in the United States by per capita income according to the U.S. Census Bureau American Community Survey 2013–2017 5-Year Estimates.[264] States with per capita incomes higher than the United States as a whole are in full green.](https://img-server.japedia.wiki/wikipedia/commons/thumb/1/18/US_states_by_per_capita_income.png/500px-US_states_by_per_capita_income.png) States in the United States by per capita income according to the U.S. Census Bureau American Community Survey 2013–2017 5-Year Estimates.[264] States with per capita incomes higher than the United States as a whole are in full green.
States in the United States by per capita income according to the U.S. Census Bureau American Community Survey 2013–2017 5-Year Estimates.[264] States with per capita incomes higher than the United States as a whole are in full green.
-
![Counties in the United States by median nonfamily household income according to the U.S. Census Bureau American Community Survey 2013–2017 5-Year Estimates.[264] Counties with median nonfamily household incomes higher than the United States as a whole are in full green.](https://img-server.japedia.wiki/wikipedia/commons/thumb/5/50/US_counties_by_median_nonfamily_income.png/500px-US_counties_by_median_nonfamily_income.png) Counties in the United States by median nonfamily household income according to the U.S. Census Bureau American Community Survey 2013–2017 5-Year Estimates.[264] Counties with median nonfamily household incomes higher than the United States as a whole are in full green.
Counties in the United States by median nonfamily household income according to the U.S. Census Bureau American Community Survey 2013–2017 5-Year Estimates.[264] Counties with median nonfamily household incomes higher than the United States as a whole are in full green. -
![States in the United States by median nonfamily household income according to the U.S. Census Bureau American Community Survey 2013–2017 5-Year Estimates.[264] States with median nonfamily household incomes higher than the United States as a whole are in full green.](https://img-server.japedia.wiki/wikipedia/commons/thumb/b/b3/US_states_by_median_nonfamily_income.png/500px-US_states_by_median_nonfamily_income.png) States in the United States by median nonfamily household income according to the U.S. Census Bureau American Community Survey 2013–2017 5-Year Estimates.[264] States with median nonfamily household incomes higher than the United States as a whole are in full green.
States in the United States by median nonfamily household income according to the U.S. Census Bureau American Community Survey 2013–2017 5-Year Estimates.[264] States with median nonfamily household incomes higher than the United States as a whole are in full green.
-
![Counties in the United States by median family household income according to the U.S. Census Bureau American Community Survey 2013–2017 5-Year Estimates.[264] Counties with median family household incomes higher than the United States as a whole are in full green.](https://img-server.japedia.wiki/wikipedia/commons/thumb/4/4c/US_counties_by_median_family_income.png/500px-US_counties_by_median_family_income.png) Counties in the United States by median family household income according to the U.S. Census Bureau American Community Survey 2013–2017 5-Year Estimates.[264] Counties with median family household incomes higher than the United States as a whole are in full green.
Counties in the United States by median family household income according to the U.S. Census Bureau American Community Survey 2013–2017 5-Year Estimates.[264] Counties with median family household incomes higher than the United States as a whole are in full green. -
![States in the United States by median family household income according to the U.S. Census Bureau American Community Survey 2013–2017 5-Year Estimates.[264] States with median family household incomes higher than the United States as a whole are in full green.](https://img-server.japedia.wiki/wikipedia/commons/thumb/f/fb/US_states_by_median_family_income.png/500px-US_states_by_median_family_income.png) States in the United States by median family household income according to the U.S. Census Bureau American Community Survey 2013–2017 5-Year Estimates.[264] States with median family household incomes higher than the United States as a whole are in full green.
States in the United States by median family household income according to the U.S. Census Bureau American Community Survey 2013–2017 5-Year Estimates.[264] States with median family household incomes higher than the United States as a whole are in full green.
Economic class
Social classes in the United States lack distinct boundaries and may overlap. Even their existence (when distinguished from economic strata) is controversial. The following table provides a summary of some prominent academic theories on the stratification of American society:
Unemployment rate (seasonally adjusted)

<3.0%
<3.5%
<4.0%
<4.5%
<5.0%
<5.5%
<6.0%
<6.5%
≥6.5%
As of July 2020[update], the U.S. unemployment rate was 10.2 percent (U3 rate).
As of July 2019[update], the U.S. unemployment rate was 3.7 percent (U3 rate).
As of July 2018[update], the U.S. unemployment rate was 3.7 percent (U3 rate).
As of July 2017[update], the U.S. unemployment rate was 4.3 percent (U3 rate).[266]
As of July 2016[update], the U.S. unemployment rate was 4.9 percent (U3 rate).[266]
As of July 2015[update], the U.S. unemployment rate was 5.3 percent (U3 rate).[267]
As of July 2014[update], the U.S. unemployment rate was 6.2 percent (U3 rate).[266]
The U6 unemployment rate as of April 2017[update] was 8.6 percent.[268] The U6 unemployment rate counts not only people without work seeking full-time employment (the more familiar U3 rate), but also counts "marginally attached workers and those working part-time for economic reasons." Some of these part-time workers counted as employed by U6 could be working as little as an hour a week. And the "marginally attached workers" include those who have become discouraged and stopped looking, but still want to work. The age considered for this calculation is 16 years and over.
Urban Americans have more job opportunities than those in more rural areas. From 2008 to 2018, 72% of the nation's employment growth occurred in cities with more than one million residents, which account for 56% of the overall population.[269]
Generational cohorts
A definitive recent study of US generational cohorts was done by Schuman and Scott (2012) in which a broad sample of adults of all ages was asked, "What world events are especially important to you?"[270] They found that 33 events were mentioned with great frequency. When the ages of the respondents were correlated with the expressed importance rankings, seven (some put 8 or 9) distinct cohorts became evident.
Today the following descriptors are frequently used for these cohorts:
- Lost Generation – born from approximately 1883 to 1900.
- Greatest Generation – born from approximately 1901 to 1927[271] (in the U.S., this was the "Depression cohort" who fought and won World War II).
- Silent Generation – born from approximately 1928 to 1945[272] during the Great Depression and World War II.[273] The label was originally applied to people in North America but has also been applied to those in Western Europe, Australasia and South America. It includes most of those who fought during the Korean War.
- Baby boomers (also known as Boomers) – born from 1946 to 1964.[272]
- Generation X – born from approximately 1965 to 1980.[272][274] In the U.S., some called Xers the "baby bust" generation because of the drop in birth rates following the baby boom.[275]
- Millennials (also known as Generation Y) – born from approximately 1981 to 1996.[272]
- Generation Z (also known as iGeneration, Digital Natives, or Zoomers) – born from approximately 1997 to 2012.[272]
- Generation Alpha – born from approximately the early 2010s to mid-2020s. [citation needed]
U.S. demographic birth cohorts
Birth rate, death rate and natural increase rate in the United States 1935–2021
Subdivided groups are present when peak boom years or inverted peak bust years are present, and may be represented by a normal or inverted bell-shaped curve (rather than a straight curve). The boom subdivided cohorts may be considered as "pre-peak" (including peak year) and "post-peak". The year 1957 was the baby boom peak with 4.3 million births and 122.7 fertility rate. Although post-peak births (such as trailing edge boomers) are in decline, and sometimes referred to as a "bust", there are still a relatively large number of births. The dearth-in-birth bust cohorts include those up to the valley birth year, and those including and beyond, leading up to the subsequent normal birth rate. The baby boom began around 1943 to 1946.[276]
From the decline in U.S. birth rates starting in 1958 and the introduction of the birth control pill in 1960, the Baby Boomer normal distribution curve is negatively skewed. The trend in birth rates from 1958 to 1961 show a tendency to end late in the decade at approximately 1969, thus returning to pre-WWII levels, with 12 years of rising and 12 years of declining birth rates. Pre-war birth rates were defined as anywhere between 1939 and 1941 by demographers such as the Taeuber's, Philip M. Hauser and William Fielding Ogburn.[277]
Mobility
In 2021, 27.1 million Americans said they were living in a different place than a year before, compared to 29.8 million in 2020. This reflects an 8.4% mover rate, the lowest recorded in more than 70 years.[278]
Education
See also



- Aging of the United States
- Demographic history of the United States
- Emigration from the United States
- Historical Statistics of the United States
- Historical racial and ethnic demographics of the United States
- Index of United States–related articles
- Languages of the United States
- Maps of American ancestries
- Outline of the United States
- Places in the United States with notable demographic characteristics
- Urbanization in the United States
Lists
- List of metropolitan areas in the Americas
- List of U.S. states and territories by fertility rate
- List of U.S. states and territories by population
- List of U.S. states and territories by race/ethnicity
- List of U.S. states by socioeconomic factors
- Lists of U.S. cities with non-white majority populations
Income
- Affluence in the United States
- Household income in the United States
- List of highest-income counties in the United States
- List of lowest-income counties in the United States
- Personal income in the United States
Population
- List of metropolitan statistical areas
- List of United States counties and county equivalents
- Office of Management and Budget
- United States urban area (list)
Notes
- ^ In fertility rates, 2.1 and above is a stable population and has been marked blue, 2 and below leads to an aging population and the result is that the population decreases.
References
- ^ a b "U.S. Population Estimated at 335,893,238 on Jan. 1, 2024".
- ^ a b c d e f g h i j k l m "United States". The World Factbook. Central Intelligence Agency. Retrieved 25 November 2024.
 This article incorporates text from this source, which is in the public domain.
- ^ a b c "List of Countries by Life Expectancy 2023". LL. October 2024. Retrieved 2024-10-31.
- ^ "Infant Mortality". cdc.gov. 22 June 2022. Retrieved 6 July 2022.
- ^ a b c "Population and Housing Unit Estimates Tables". Census.gov. Retrieved 2022-06-30.
- ^ a b c d e f g h i j k "Race and Ethnicity in the United States: 2010 Census and 2020 Census". U.S. Census Bureau. August 12, 2021. Archived from the original on October 7, 2021. Retrieved September 18, 2021.
- ^ "Detailed Races and Ethnicities in the United States and Puerto Rico: 2020 Census". United States census. September 21, 2023. Retrieved October 21, 2023.
- ^ "Detailed Races and Ethnicities in the United States and Puerto Rico: 2020 Census". United States census. September 21, 2023. Retrieved October 21, 2023.
- ^ "Detailed Races and Ethnicities in the United States and Puerto Rico: 2020 Census". United States census. September 21, 2023. Retrieved October 21, 2023.
- ^ "Detailed Races and Ethnicities in the United States and Puerto Rico: 2020 Census". United States census. September 21, 2023. Retrieved October 21, 2023.
- ^ "Detailed Races and Ethnicities in the United States and Puerto Rico: 2020 Census". United States census. September 21, 2023. Retrieved October 21, 2023.
- ^ "Detailed Races and Ethnicities in the United States and Puerto Rico: 2020 Census". United States census. September 21, 2023. Retrieved October 21, 2023.
- ^ Kaczke, Lisa (25 March 2019). "South Dakota recognizes official indigenous language". Argus Leader.
- ^ "Samoa now an official language of instruction in American Samoa". Radio New Zealand International. 2008-10-03.
- ^ "Guam". Encyclopædia Britannica. 2018-10-24.
- ^ "Northern Mariana Islands". Encyclopædia Britannica. 2018-10-19.
- ^ Crawford, James. "Puerto Rico and Official English". Language Policy.net. Retrieved April 27, 2011.
- ^ "Census Bureau Projects U.S. and World Populations on New Year's Day". U.S. Department of Commerce. 2024-01-03. Retrieved 2024-09-26.
- ^ a b "Population Clock". U.S. Census Bureau.
- ^ "Growth in U.S. Population Shows Early Indication of Recovery Amid COVID-19 Pandemic".
- ^ "Population growth rate". The World Factbook. Central Intelligence Agency. Retrieved 25 November 2024.
- ^ "Illinois ranks as 'most normal state' in U.S. according to Washington Post data analysis". Illinois. WMAQ-TV. 2024-05-14. Retrieved 2024-05-15.
- ^ a b "Statistical Abstract of the United States" (PDF). U.S. Census Bureau. 2005. Retrieved October 25, 2015.
- ^ "U.S. population hits 300 million mark". MSNBC. Associated Press. October 17, 2006. Archived from the original on October 17, 2006. Retrieved October 17, 2006.
- ^ "Modern Immigration Wave Brings 59 Million to U.S." Pew Research Center's Hispanic Trends Project. September 28, 2015.
- ^ "Changing Patterns in U.S. Immigration and Population". The Pew Charitable Trusts. 18 December 2014.
- ^ "Annual Report 2021". USA Facts. Archived from the original on May 11, 2021. Retrieved May 11, 2021.
- ^ "Children of color projected to be majority of U.S. youth this year". PBS NewsHour. January 9, 2020.
- ^ "Racial and Ethnic Diversity in the United States: 2010 Census and 2020 Census". U.S. Census Bureau. Retrieved 2022-03-03.
- ^ a b "2020 Census Illuminates Racial and Ethnic Composition of the Country". Census.gov. Retrieved 2022-06-27.
- ^ "U.S. Population Projections: 2005–2050". Pew Hispanic Center. February 11, 2008. Retrieved September 19, 2011.
- ^ a b Lemi, Danielle Casarez (2021-09-23). "Analysis - U.S. census racial categories have shifted over centuries. How will the jump in multiracials affect politics?". Washington Post. Retrieved 2023-06-19. "Asian Americans — the fastest-growing racial group in America — grew 35.5 percent, while Asian plus another race grew 55.5 percent."
- ^ a b Foster-Frau, Silvia (2021-10-08). "'We're talking about a big, powerful phenomenon': Multiracial Americans drive change". Washington Post. Retrieved 2023-06-19.
- ^ a b "U.S. births in 2022 didn't return to pre-pandemic levels". STAT. Associated Press. 2023-06-01. Retrieved 2023-06-19. "Births to Hispanic moms rose 6% last year and surpassed 25% of the U.S. total. Births to white moms fell 3%, but still accounted for 50% of births. Births to Black moms fell 1%, and were 14% of the total."
- ^ a b America, Good Morning (2023-06-01). "Teenage birth rates in the US hit record lows in 2022: CDC report". Good Morning America. Retrieved 2023-06-19. "Among race/ethnicity between 2021 and 2022, the provisional number of births declined 3% for American Indian/Alaska Native and white women and by 1% for Black women from 2021 to 2022. However, birth rates rose 2% for Asian women and 6% for Native Hawaiian/Pacific Islander and Hispanic women."
- ^ "US Population Rises to 331,449,281, Census Bureau Says". U.S. News & World Report. Retrieved May 10, 2021.
- ^ a b "Statistical abstract of the United States, 1951, p8, Est. population of continental US excluding overseas armed forces" (PDF). U.S. Census Bureau.
- ^ a b "Current population reports, 1962, p2" (PDF). U.S. Census Bureau.
- ^ a b c d e "National Population by Characteristics: 2020-2021". Census.gov. Retrieved 2022-07-06.
- ^ a b c "Births: Provisional Data for 2022" (PDF). cdc.gov. 1 June 2023. Retrieved 3 June 2023.
- ^ "Quarterly Provisional Estimates for Mortality Dashboard". www.cdc.gov. 2022-07-20. Retrieved 2022-07-20.
- ^ Murphy, Sherry; Kochanek, Kenneth; Xu, Jiaquan; Arias, Elizabeth (2021). "Mortality in the United States, 2020" (PDF). NCHS Data Brief (427). CDC: 1–8. PMID 34978528. Retrieved 1 March 2022.
- ^ Weinstein, Jay; Pillai, Vijayan K. (29 October 2015). Demography: The Science of Population (2nd ed.). Rowman & Littlefield. p. 208. ISBN 978-1-44223521-2.
- ^ Doan, Alesha E. (2007). Opposition and Intimidation:The abortion wars and strategies of political harassment. University of Michigan Press. p. 40. ISBN 978-0-472-06975-0.
- ^ a b c Belluz, Julia (13 January 2020). "The historically low birthrate, explained in 3 charts". Vox. Retrieved 25 November 2024.
- ^ a b Stone, Lyman (May 16, 2018). "Baby Bust: Fertility is Declining the Most Among Minority Women". Institute for Family Studies. Retrieved 25 November 2024.
- ^ "Vital Statistics Rapid Release Quarterly Provisional Estimates". June 29, 2022. Retrieved 10 July 2022.
- ^ a b c d e f g h i Births: Final Data for 2020 (PDF) (Report). Centers for Disease Control and Prevention. 7 February 2022. p. 50. Archived (PDF) from the original on 2022-02-07. Retrieved 25 November 2024.
- ^ "Dependency ratios - The World Factbook". www.cia.gov. Retrieved 2022-07-06.
- ^ a b c "Life expectancy at birth - The World Factbook". www.cia.gov. Retrieved 2024-04-05.
- ^ a b c "List of Countries by Life Expectancy 2023 | life —— lines". 2024-01-22. Retrieved 2024-04-05.
- ^ a b Arias, Elizabeth; Tejada-Vera, Betzaida; Kochanek, Kenneth D; Ahmad, Farida B (August 2022). "Provisional Life Expectancy Estimates for 2021" (PDF). CDC.GOV. Retrieved August 31, 2022.
- ^ Saiidi, Upton (July 9, 2019). "US life expectancy has been declining. Here's why". CNBC Markets.
- ^ a b c d Arias, Elizabeth; Xu, Jiaquan (August 8, 2022). "United States Life Tables, 2020" (PDF). National Vital Statistics Reports: From the Centers for Disease Control and Prevention, National Center for Health Statistics, National Vital Statistics System. 71 (1): 1–64. PMID 35947823. Retrieved August 9, 2022.
- ^ "CDC - NCHS - National Center for Health Statistics". www.cdc.gov. 2022-08-30. Retrieved 2022-08-31.
- ^ a b "PEPANNRES – Annual Estimates of the Resident Population: April 1, 2010 to July 1, 2018". U.S. Census Bureau. Archived from the original on February 14, 2020. Retrieved October 17, 2019.
- ^ "Table 13. State Population – Rank, Percent Change, and Population Density". U.S. Census Bureau. 2008. Archived from the original (Excel) on September 23, 2015. Retrieved October 24, 2010.
- ^ "Mean Center of Population for the United States: 1790 to 2000" (PDF). U.S. Census Bureau. Archived from the original (PDF) on November 3, 2001. Retrieved October 24, 2010.
- ^ "Annual Estimates of the Resident Population for Incorporated Places over 110,000, Ranked by July 1, 2009 Population: April 1, 2000 to July 1, 2009 (SUB-EST2009-01)". U.S. Census Bureau. Archived from the original on October 18, 2010. Retrieved May 19, 2011.
- ^ "The World Factbook: Puerto Rico". CIA. Retrieved July 1, 2020.
- ^ "The World Factbook: Northern Mariana Islands". CIA. Retrieved July 1, 2020.
- ^ "The World Factbook: American Samoa". CIA. Retrieved July 1, 2020.
- ^ a b c Mary Kekatos (May 24, 2022). "1st increase in births reported in 7 years, CDC finds". ABC News.
- ^ "Quarterly Provisional Estimates". Centers for Disease Control and Prevention. February 16, 2023.
- ^ "Number of Births by Race". Kaiser Family Foundation. April 20, 2022.
- ^ Wendell Cox (July 28, 2022). "US TOTAL FERTILITY RATES: TOWARD EUROPE?". newgeography.com.
- ^ Osterman, Michelle J.K.; Hamilton, Brady E.; Martin, Joyce A.; Driscoll, Anne K.; Valenzuela, Claudia P. (January 31, 2023). "Births: Final Data for 2021" (PDF). National Vital Statistics Reports. 72 (1): 1–53. PMID 36723449.
- ^ a b Brady E. Hamilton; Michelle J.K. Osterman; Joyce A. Martin (March 2022). "Changes in Births by Month: United States, January 2019–June 2021" (PDF). Centers for Disease Control and Prevention.
- ^ a b c "Births: Final Data for 2014" (PDF). Centers for Disease Control and Prevention. Retrieved October 3, 2017.
- ^ "National Vital Statistics Reports. Births: Final Data for 2015" (PDF). Centers for Disease Control and Prevention. Retrieved October 3, 2017.
- ^ Perry, Susan (January 11, 2019). "U.S. fertility rate continues to decline, reaching lowest level in 40 years". MinnPost.
- ^ "NVSS - Birth Data". Centers for Disease Control and Prevention. June 14, 2021.
- ^ Camarota, Steven A.; Zeigler, Karen. "The Declining Fertility of Immigrants and Natives" (PDF). Cis.org. Retrieved October 3, 2017.
- ^ "Immigrant and Emigrant Populations". Migration Policy Institute. 10 February 2014. Retrieved 24 July 2023.
- ^ Leonhardt, David (12 June 2024). "The Force Shaping Western Politics". The New York Times. Archived from the original on 12 June 2024.
- ^ a b c d Radford, Jynnah (June 17, 2019). "Key findings about U.S. immigrants". Pew Research Center.
- ^ a b Krogstad, Jens Manuel (October 7, 2019). "Key facts about refugees to the U.S." Pew Research Center.
- ^ "New Population Estimates Show COVID-19 Pandemic Significantly Disrupted Migration Across Borders". Census.gov. Retrieved 2022-07-20.
- ^ "Largest region-of-birth group of immigrants in US" (PDF). U.S. Census Bureau. Archived from the original (PDF) on February 9, 2015. Retrieved October 3, 2017.
- ^ "Introduction: Immigration from Latin America and Caribbean". Harvard University. Archived from the original on 2019-02-28.
- ^ "Table 3. Persons Obtaining Lawful Permanent Resident Status by Region and Country of Birth: Fiscal Years 2018 to 2020". Yearbook of Immigration Statistics. Department of Homeland Security. January 6, 2022. Retrieved 7 February 2021.
- ^ "Frequently Requested Statistics on Immigrants and Immigration in the United States". Migration Policy Institute. March 14, 2019.
- ^ "Table 1. Persons Obtaining Lawful Permanent Resident Status: Fiscal Years 1820 to 2018". Yearbook of Immigration Statistics. Department of Homeland Security. December 19, 2019. Retrieved 12 January 2020.
- ^ "Yearbook 2021 | Homeland Security". www.dhs.gov. Retrieved 2022-12-14.
- ^ "Yearbook 2021 | Homeland Security". www.dhs.gov. Retrieved 2022-12-14.
- ^ "Table 6. Persons Obtaining Lawful Permanent Resident Status by Type and Major Class of Admission: Fiscal Years 2018 to 2020". Yearbook of Immigration Statistics. Department of Homeland Security. December 19, 2019. Retrieved 7 February 2022.
- ^ a b c d e f g "COVID-19, Declining Birth Rates and International Migration Resulted in Historically Small Population Gains". US Census B.gov. Retrieved 2022-02-16.
- ^ a b c "Provisional number of marriages and marriage rate, divorces and annulments and rate, 2000–2020" (PDF). Centers for Disease Control and Prevention/NCHS National Vital Statistics System. Archived (PDF) from the original on February 16, 2022. Retrieved February 16, 2022.
- ^ "Marriage rates by State: 1990, 1995, and 1999–2019" (PDF). Centers for Disease Control and Prevention/NCHS, National Vital Statistics System. Archived (PDF) from the original on February 14, 2022. Retrieved February 16, 2022.
- ^ Sullivan, Amy (March 20, 2009). "Behind the Boom in Adult Single Motherhood". Time. Archived from the original on March 22, 2009.
- ^ "Blacks rank highest in unwed births". Florida Today. Melbourne, Florida. November 7, 2010. p. 9A. Archived from the original on June 14, 2011. Retrieved November 9, 2010.
- ^ "Births to unmarried women, by race and Hispanic origin of mother: United States, each state and territory, 2020" (PDF). National Vital Statistics Reports. 17 (70). CDC. March 7, 2022. Retrieved February 16, 2022.
- ^ "Birthrate Is Lowest in a Century". The New York Times. Associated Press. August 27, 2010. Retrieved August 28, 2010.
- ^ Kowlessar, N.M.; Jiang, H.J.; Steiner, C. (October 2013). "Hospital Stays for Newborns, 2011". HCUP Statistical Brief (163). Rockville, MD: Agency for Healthcare Research and Quality. PMID 24308074.
- ^ Roan, Shari (March 31, 2011). "Drop in U.S. birth rate is the biggest in 30 years". Los Angeles Times.
- ^ a b "America's Birth Rate Declined For The Third Year Running". Business Insider. August 12, 2011.
- ^ "Health and Wellness". USA Today.
- ^ "Lower birth rate blamed on the economy". WZZM. February 9, 2013. Archived from the original on February 9, 2013. Retrieved October 3, 2017.
- ^ a b c d "Teen Birth Rates Declined Again in 2009". Centers for Disease Control and Prevention. June 27, 2019. Archived from the original on July 4, 2011.
- ^ "Teen Birth Rates Drop, But Disparities Persist". Centers for Disease Control and Prevention. March 6, 2020.
- ^ Lahmeyer, Jan (January 22, 2000). "United States of America: historical demographical data of the whole country". Population Statistics. Archived from the original on July 23, 2019. Retrieved October 16, 2013.
- ^ "Data Access – Vital Statistics Online". Centers for Disease Control and Prevention. May 13, 2019.
- ^ 1960 to 2011"United States – Death rate: Death rate, crude (per 1,000 people)". Index Mundi. Retrieved October 24, 2013.
- ^ a b Historical Statistics of the United States – Colonial Times To 1970 – Part 1 (PDF) (Report) (Bicentennial ed.). U.S. Department of Commerce. Bureau of Census. 1975. pp. 19, 50.
- ^ "National Vital Statistics Reports. Births: Final Data for 2017" (PDF). Centers for Disease Control and Prevention. Retrieved December 27, 2018.
- ^ "Products – Data Briefs – Number 328 – November 2018". Centers for Disease Control and Prevention. June 7, 2019.
- ^ "2019 U.S. Population Estimates Continue to Show the Nation's Growth Is Slowing". U.S. Census Bureau. December 30, 2019. Retrieved December 30, 2019.
- ^ "Mortality in the United States, 2018". Centers for Disease Control and Prevention. January 29, 2020. Retrieved 30 January 2020.
- ^ "COVID-19 Coding and Reporting Guidance – Monthly Birth Counts for Maternal Coronavirus Disease (COVID-19)". Centers for Disease Control and Prevention. 2021-03-08. Retrieved 2021-03-13.
- ^ "Mortality in the United States, 2020" (PDF). NCHS Data Brief (427). CDC. Archived (PDF) from the original on December 22, 2021. Retrieved 2021-12-21.
- ^ "Births: Provisional Data for 2021" (PDF). Retrieved 24 May 2022.
- ^ Ahmad, Farida B. (2022). "Provisional Mortality Data — United States, 2021". MMWR. Morbidity and Mortality Weekly Report. 71 (17): 597–600. doi:10.15585/mmwr.mm7117e1. ISSN 0149-2195. PMC 9098238. PMID 35482572.
- ^ a b c d e "Births: Final Data for 2022" (PDF). CDC>NCHS>National Vital Statistics System. US CDC. Retrieved 8 April 2024.
- ^ Ahmad, Farida B. (2023). "Provisional Mortality Data — United States, 2022". MMWR. Morbidity and Mortality Weekly Report. 72 (18): 488–492. doi:10.15585/mmwr.mm7218a3. ISSN 0149-2195. PMC 10168603. PMID 37141156.
- ^ Fitzpatrick, Alex; Beheraj, Kavya (October 4, 2023). "The birth rate ticked up in 2022. Can the reversal last?". Axios. Retrieved October 7, 2023.
- ^ "CDC WONDER". CDC WONDER. US CDC. Retrieved 2 April 2024.
- ^ "CDC WONDER". CDC WONDER. US CDC. Retrieved 2 April 2024.
- ^ "Population Projections". U.S. Census Bureau.
- ^ "Observed and Total Population for the U.S. and the States, 2010-2040".
- ^ "Decennial Census by Decades". U.S. Census Bureau. Retrieved 2021-04-27.
- ^ "Chapter Z Colonial and Pre-Federal Statistics" (PDF).
- ^ Resident Population Data. "Resident Population Data – 2010 Census". U.S. Census Bureau. Retrieved February 22, 2013.
- ^ "Historical Census Statistics on Population Totals By Race, 1790 to 1990..." U.S. Census Bureau. Archived from the original on July 25, 2008. Retrieved May 28, 2013.
- ^ Hobbs, Frank; Stoops, Nicole (November 2002). "Census 2000 Special Reports: Demographics Trends in the 20th Century" (PDF). U.S. Census Bureau. Archived from the original (PDF) on January 20, 2012.
- ^ Bennett, Claudette E. (September 1993). "We the Americans: Blacks" (PDF). U.S. Census Bureau. Archived from the original (PDF) on 2010-03-26.
- ^ Saenz, Rogelio (August 2004). "Latinos and the Changing Face of America". Population Reference Bureau. Archived from the original on May 19, 2012.
- ^ Fredrickson, George M. (2005). Foner, Nancy; Fredrickson, George M. (eds.). Not Just Black and White: Historical and Contemporary Perspectives on Immigration, Race, and Ethnicity in the United States. Russell Sage Foundation. p. 120. ISBN 0-87154-270-6.
- ^ Papademetriou, Demetrios G.; Terrazas, Aaron (April 2009). "Immigrants in the United States and the Current Economic Crisis". Migration Policy Institute. Archived from the original on 2010-03-04.
- ^ Segal, Uma A.; Elliott, Doreen; Mayadas, Nazneen S. (2010). Immigration Worldwide: Policies, Practices, and Trends. Oxford University Press US. p. 32. ISBN 978-0-19-538813-8.
- ^ Borjas, George J. (2003). "Welfare reform, labor supply, and health insurance in the immigrant population". Journal of Health Economics. 22 (6): 933–958. CiteSeerX 10.1.1.517.7531. doi:10.1016/j.jhealeco.2003.05.002. ISSN 0167-6296. PMID 14604554. S2CID 488620.
- ^ "The First Measured Century: An Illustrated Guide to Trends in America, 1900–2000". Public Broadcasting Service.
- ^ Exner, Rich (July 3, 2012). "Americans under age 1 now mostly minorities, but not in Ohio: Statistical Snapshot". The Plain Dealer. Retrieved July 29, 2012.
- ^ "Non-white births outnumber white births for the first time in US". The Daily Telegraph. May 17, 2012. Archived from the original on 2012-05-18.
- ^ "Median Age Of The Total Population". American FactFinder. Archived from the original on February 12, 2020. Retrieved October 3, 2017.
- ^ a b Howard, Jacqueline (January 10, 2019). "US fertility rate is below level needed to replace population, study says". CNN.
- ^ Mathews, T.J.; Hamilton, Brady E. (January 10, 2019). "Total Fertility Rates by State and Race and Hispanic Origin: United States, 2017" (PDF). Centers for Disease Control and Prevention.
- ^ Tavernise, Sabrina (June 20, 2018). "Fewer Births Than Deaths Among Whites in Majority of U.S. States". The New York Times.
- ^ a b Patino, Marie (May 15, 2019). "U.S. Births Fell to Lowest Level in 32 Years in 2018". Bloomberg News.
- ^ a b c d "A Look at the 1940 Census" (PDF). United States Census Bureau. pp. 9, 10, 11, 12, 13.
- ^ "Table A. Apportionment Population, Resident Population, and Overseas Population: 2020 Census and 2010 Census" (PDF).
- ^ a b c Martin, Joyce A.; Hamilton, Brady E.; Driscoll, Anne K.; Osterman, Michelle J. K.; Valenzuela, Claudia P. (February 7, 2022). "Births: Final Data for 2020" (PDF). National Vital Statistics Reports. 70 (1). CDC: 12. PMID 35157571.
- ^ a b c Weinstein, Jay; Pillai, Vijayan K. (2016). Demography: The Science of Population (2nd ed.). Rowman & Littlefield. p. 208. ISBN 978-1-442235212.
- ^ a b c d e "Life expectancy". Our World in Data. Retrieved August 28, 2018.
- ^ except 1918 with only 47 years
- ^ "World Population Prospects – Population Division". United Nations Department of Economic and Social Affairs. Archived from the original on September 19, 2016. Retrieved August 25, 2018.
- ^ a b Hobbs, Frank; Stoops, Nicole (November 2002). "Demographic Trends in the 20th Century. Census 2000 Special Reports" (PDF). U.S. Census Bureau, U.S. Department of Commerce. pp. 56, 77.
- ^ "Feature Article 1: Population by Age and Sex, Australian States and Territories". Australian Bureau of Statistics. 16 December 2011.
- ^ "The 2012 Global Cities Index". A.T. Kearney. Archived from the original on February 15, 2013. Retrieved January 5, 2013.
- ^ "The World According to GaWC – Classification of cities 2010". 2010. Archived from the original on October 10, 2013. Retrieved January 5, 2013.
- ^ "American cities on the rebound". CBS News. August 5, 2011. Retrieved May 8, 2013.
- ^ "Metropolitan and Micropolitan Statistical Areas Population Totals: 2020–2023". United States Census Bureau. May 2023. Retrieved February 14, 2024.
- ^ "P004HISPANIC OR LATINO, AND NOT HISPANIC OR LATINO BY RACE [73] - United States". United States Census Bureau.
- ^ "P2 HISPANIC OR LATINO, AND NOT HISPANIC OR LATINO BY RACE - 2010: DEC Redistricting Data (PL 94-171) - United States". United States Census Bureau.
- ^ "P2 HISPANIC OR LATINO, AND NOT HISPANIC OR LATINO BY RACE - 2020: DEC Redistricting Data (PL 94-171) - United States". United States Census Bureau.
- ^ "Race and Ethnicity in the United States: 2010 Census and 2020 Census". U.S. Census Bureau. Retrieved December 2, 2021.
- ^ Jin, Connie Hanzhang; Talbot, Ruth; Lo Wang, Hansi (August 13, 2021). "What The New Census Data Shows About Race Depends On How You Look At It". NPR.
- ^ a b "DP05 – ACS Demographic and Housing Estimates". U.S. Census Bureau. Archived from the original on February 14, 2020. Retrieved October 17, 2019.
- ^ "2020 Census Frequently Asked Questions About Race and Ethnicity".
- ^ a b "2010 Census Demographic Profile Summary File" (PDF). U.S. Census Bureau. Retrieved August 25, 2017.
- ^ a b c d e "About Race". United States Census Bureau.
- ^ "Revisions to the Standards for the Classification of Federal Data on Race and Ethnicity". The White House. Retrieved 14 July 2024.
- ^ "Population Distribution by Race/Ethnicity". Kaiser Family Foundation. October 28, 2022.
- ^ "Grid View: Table B02001 - Census Reporter". censusreporter.org. Retrieved 2024-06-28.
- ^ "Grid View: Table B03002 - Census Reporter". censusreporter.org. Retrieved 2024-06-28.
- ^ a b c d "National Population by Characteristics: 2020-2021". Census.gov. Retrieved 2022-06-30.
- ^ Schaeffer, Katherine (July 30, 2019). "The most common age among whites in U.S. is 58 – more than double that of racial and ethnic minorities". Pew Research Center.
- ^ "ACS Demographic and Housing Estimates – 2011–2015". U.S. Census Bureau. Archived from the original on February 13, 2020. Retrieved August 26, 2017.
- ^ "Grid View: Table B03002 - Census Reporter". censusreporter.org. Retrieved 2024-06-29.
- ^ "American Samoa 2010 Demographic Profile". American FactFinder. Archived from the original on May 3, 2017. Retrieved July 1, 2020.
- ^ "Guam 2010 Demographic Profile". American FactFinder. Archived from the original on April 13, 2016. Retrieved July 1, 2020.
- ^ "Northern Mariana Islands 2010 Demographic Profile". American FactFinder. Archived from the original on November 6, 2018. Retrieved July 1, 2020.
- ^ "The World Factbook: U.S. Virgin Islands". CIA. Retrieved July 1, 2020.
- ^ a b National Center for Education Statistics (February 2019). "Indicator 1: Population Distribution".
- ^ Cohn, D'Vera (June 26, 2014). "Falloff in births slows shift to a majority-minority youth population". Pew Research Center.
- ^ "About Hispanic Origin". U.S. Census Bureau. Retrieved August 26, 2017.
- ^ "Overview of 2020 AIAN Redistricting Data: 2020" (PDF). Archived from the original (PDF) on January 26, 2022. Retrieved January 16, 2022.
- ^ Bureau, US Census. "A Look at the Largest American Indian and Alaska Native Tribes and Villages in the Nation, Tribal Areas and States". Census.gov. Retrieved 2024-06-29.
{{cite web}}:|last=has generic name (help) - ^ "Grid View: Table B02017 - Census Reporter". censusreporter.org. Retrieved 2024-06-29.
- ^ "Grid View: Table B03002 - Census Reporter". censusreporter.org. Retrieved 2024-06-29.
- ^ "Grid View: Table B02001 - Census Reporter". censusreporter.org. Retrieved 2024-06-29.
- ^ "Federal Register" (PDF). Retrieved September 14, 2016.
- ^ "Grid View: Table B02017 - Census Reporter". censusreporter.org. Retrieved 2024-06-29.
- ^ "Grid View: Table B02019 - Census Reporter". censusreporter.org. Retrieved 2024-06-29.
- ^ "Census profile: United States". Census Reporter. Retrieved 2024-06-29.
- ^ Davenport, Christian (April 20, 2010). "A disconnect at Magruder". The Washington Post. Washington, DC. p. B1.
- ^ Hsu, Spencer S. (May 2, 2010). "Senate Democrats' plan highlights nation's shift to the right on immigration". The Washington Post. Washington, DC. p. A3.
- ^ "How European and U.S. unauthorized immigrant populations compare". Pew Research Center. November 13, 2019. Retrieved 2020-01-07.
- ^ "Grid View: Table B26103 - Census Reporter". censusreporter.org. Retrieved 2024-06-29.
- ^ Bureau, US Census. "2023 National Population Projections Tables: Main Series". Census.gov. Retrieved 2024-06-29.
{{cite web}}:|last=has generic name (help) - ^ "U.S. Hispanic population to triple by 2050". USA Today. February 11, 2008.
- ^ Bureau, US Census. "2023 National Population Projections Tables: Main Series". Census.gov. Retrieved 2024-06-29.
{{cite web}}:|last=has generic name (help) - ^ "Methodology, Assumptions, and Inputs for the 2023 National Population Projections" (PDF). US Census Bureau. July 3, 2024.
- ^ "The Population Estimates "Blended Base:" What it is and Why it Matters". CTData. 2024-05-08. Retrieved 2024-07-03.
- ^ "Grid View: Table B02013 - Census Reporter". censusreporter.org. Retrieved 2024-07-04.
- ^ "Census Bureau discusses new "blended base" methodology for annual Population Estimates - EconSpark". www.aeaweb.org. Retrieved 2024-07-04.
- ^ "Grid View: Table B02001 - Census Reporter". censusreporter.org. Retrieved 2024-07-04.
- ^ Bureau, US Census. "2023 National Population Projections Tables: Main Series". Census.gov. Retrieved 2024-06-29.
{{cite web}}:|last=has generic name (help) - ^ a b "International Database (IDB)". U.S. Census Bureau. Retrieved June 27, 2022.
- ^ Ohlemacher, Stephen (August 13, 2008). "White Americans no longer a majority by 2042". Associated Press. Archived from the original on August 24, 2008.
- ^ Aizenman, N.C. (August 13, 2008). "U.S. to Grow Grayer, More Diverse". The Washington Post. Retrieved May 8, 2013.
- ^ Passel, Jeffrey (February 11, 2008). "Immigration to Play Lead Role In Future U.S. Growth". Pew Research Center. Archived from the original on January 3, 2010. Retrieved May 8, 2013.
- ^ "The Majority of American Babies Are Now Minorities". Bloomberg. July 25, 2015.
- ^ "Births: Provisional Data for 2021" (PDF). Retrieved 10 July 2022.
- ^ a b c d "United States Population 2018". World Population Review.
- ^ Passel, Jeffrey S.; Conh, D'Vera (February 11, 2008). "U.S. Population Projections: 2005–2050". Pew Research Center.
- ^ "United Nations, Department of Economic and Social Affairs, Population Division (2019). World Population Prospects 2019". 2019. Retrieved August 21, 2019.
- ^ "Grid View: Table B04007 - Census Reporter". censusreporter.org. Retrieved 2024-07-01.
- ^ "Grid View: Table B04006 - Census Reporter". censusreporter.org. Retrieved 2024-06-29.
- ^ "Grid View: Table B03001 - Census Reporter". censusreporter.org. Retrieved 2024-06-29.
- ^ "Grid View: Table B02018 - Census Reporter". censusreporter.org. Retrieved 2024-06-29.
- ^ "Grid View: Table B02019 - Census Reporter". censusreporter.org. Retrieved 2024-06-30.
- ^ "Grid View: Table B04004 - Census Reporter". censusreporter.org. Retrieved 2024-06-30.
- ^ "Measuring Religion in Pew Research Center's American Trends Panel". Pew Research Center. 14 January 2021. Archived from the original on 8 February 2021. Retrieved 9 February 2021.
- ^ Table No. 68. Religious Bodies – Selected Data (p. 59), "Statistical Abstract of the United States: 2004–2005 (tables 67–69)" (PDF). U.S. Census Bureau.
- ^ "Statistical Abstract of the United States: 2004–2005 (tables 67–69)" (PDF). U.S. Census Bureau.
- ^ "Statistics on Religion in America Report". Pew Forum on Religion & Public Life.
- ^ "America's Changing Religious Landscape". Pew Forum on Religion & Public Life. Pew Research Center's Religion & Public Life Project. May 12, 2015. Retrieved October 9, 2016.
- ^ "In U.S., Decline of Christianity Continues at Rapid Pace". Pew Forum on Religion & Public Life. October 17, 2019. Retrieved October 19, 2019.
- ^ "Global Religious Futures: A Pew-Templeton Project". Pew Research. Archived from the original on May 3, 2013.
- ^ a b "American Baptist Association – Membership Data". Association of Religion Data Archives. Archived from the original on November 27, 2020. Retrieved August 1, 2019.
- ^ "Summary of Denominational Statistics" (PDF). American Baptist Churches U.S.A. 2017.
- ^ a b c "AG Churches, Membership, Adherents and Ministers 1960–2018" (PDF). Assemblies of God USA.
- ^ a b c "Baptist Bible Fellowship International – Membership Data". Association of Religion Data Archives. Archived from the original on September 21, 2020. Retrieved October 28, 2019.
- ^ a b "Baptist Missionary Association of America – Membership Data". Association of Religion Data Archives. Archived from the original on November 11, 2020. Retrieved August 23, 2019.
- ^ Walton, Jeffrey (August 20, 2019). "Disciples of Christ Claim Distinction of Fastest Declining Church". Juicy Ecumenism. Retrieved 2019-11-14.
- ^ a b "Church of the Brethren denominational membership falls below 100,000". Church of the Brethren Newsline. January 27, 2021. Retrieved March 9, 2021.
- ^ a b "Churches Of Christ In The United States – Statistical Summary" (PDF). 21st Century Christian. Archived from the original (PDF) on July 29, 2020. Retrieved October 9, 2019.
- ^ a b "Table of Statistics of the Episcopal Church From 2018 Parochial Reports" (PDF). Episcopal Church. 2018. Archived from the original (PDF) on September 5, 2019. Retrieved September 9, 2019.
- ^ a b "ELCA Facts". Evangelical Lutheran Church in America. Archived from the original on September 25, 2016. Retrieved August 16, 2019.
- ^ "About the EPC". Evangelical Presbyterian Church.
- ^ a b c "Greek Orthodox Archdiocese of America – Membership Data". Association of Religion Data Archives. Archived from the original on April 25, 2021. Retrieved September 17, 2019.
- ^ a b c "Rosters and Statistics". The Lutheran Church-Missouri Synod. November 2018. Retrieved 9 June 2019.
- ^ a b c "National Association of Free Will Baptists – Membership Data". Association of Religion Data Archives. Archived from the original on May 5, 2011. Retrieved September 21, 2019.
- ^ a b c d "Statistics". Baptist World Alliance. Archived from the original on September 27, 2019.
- ^ a b c "Orthodox Church in America – Membership Data". Association of Religion Data Archives. Archived from the original on November 11, 2020. Retrieved October 17, 2019.
- ^ "PCA Statistics Five Year Summary". PCA Administrative Committee.
- ^ a b "Comparative Summaries of Statistics 2018" (PDF). Presbyterian Church USA. Retrieved 2019-06-03.
- ^ "Comparative Summaries of Statistics 2020" (PDF). Presbyterian Church USA.
- ^ "Church Statistical Data". Reformed Church in America.
- ^ "Catholics". Adherents.com. Archived from the original on October 3, 2003. Retrieved September 19, 2011.
- ^ "Section 1. Population" (PDF). Statistical Abstract of the United States: 2004–2005. U.S. Census Bureau. p. 55. Retrieved June 29, 2008. (Table No. 67. Self-described religious identification of adult population: 1990 and 2001; data for 2001).
- ^ a b "Southern Baptist Convention continues statistical decline, Floyd calls for rethinking ACP process". Baptist Press. June 4, 2020. Retrieved 8 June 2020.
- ^ "UMData". umdata.org.
- ^ a b "2019 WELS Annual Report". Wisconsin Evangelical Lutheran Synod. Retrieved July 23, 2019.
- ^ "By 2040, Islam will be second largest religion in US: Study". Hindustan Times. January 12, 2018.
- ^ a b Kosmin, Barry A.; Keysar, Ariela (2009). "American Religious Identification Survey (ARIS) 2008" (PDF). Trinity College. Hartford, Connecticut, USA. Archived from the original (PDF) on April 7, 2009. Retrieved April 1, 2009.
- ^ a b c d e "Religion in America: U.S. Religious Data, Demographics and Statistics". Pew Research Center. Retrieved October 19, 2019.
- ^ "2000 Census information on Gay and Lesbian Couples". Gay Demographics.org. Archived from the original on July 1, 2009.
- ^ Gates, Gary J. "Same-sex Couples and the Gay, Lesbian, Bisexual Population: New Estimates from the American Community Survey" (PDF). UCLA. Retrieved 4 March 2024.
- ^ Gates, Gary J. (October 2006). "Same-sex Couples and the Gay, Lesbian, Bisexual Population: New Estimates from the American Community Survey" (PDF). The Williams Institute on Sexual Orientation Law and Public Policy, UCLA School of Law. Archived from the original (PDF) on July 2, 2007. Retrieved April 20, 2007.
- ^ Gates, Gary. "How many people are lesbian, gay, bisexual, and transgender?" (PDF). The Williams Institute, UCLA School of Law. Retrieved 24 February 2019.
- ^ "Research 4M adults in US identify as gay". Florida Today. Melbourne, Florida. March 1, 2011. p. 1A.
- ^ a b "Place Of Birth For The Foreign-Born Population In The United States. Universe: Foreign-born population excluding population born at sea more information. 2017 American Community Survey 1-Year Estimates". United States Census Bureau. Archived from the original on February 14, 2020. Retrieved August 6, 2019.
- ^ Alperin, Elijah; Batalova, Jeanne (1 August 2018). "European Immigrants in the United States – Immigration Pathways and Naturalization". Migration Policy Institute.
- ^ "How Are We Counted?". American Citizens Abroad. April 2017. Retrieved 22 September 2019.
The Federal Voting Assistance Program (FVAP) estimates that there are 4.5 million to 6.5 million overseas Americans while the State Department's most recent calculation (April 2015) of US citizens living overseas is 8.7 million{...}US citizens living outside the US who are not employed by the US Government, including dependents living with them – Not counted in the census.
- ^ Smith, Claire M. "These are our Numbers: Civilian Americans Overseas and Voter Turnout" (PDF). Overseas Vote Foundation. Archived from the original (PDF) on October 24, 2013. (Originally published in OVF Research Newsletter, vol. 2, issue 4, August 2010).
- ^ Trow, Steve; Bruce, Charles (2007-03-26). "U.S. Citizens Who Don't Know It" (PDF). Legal Times. 30 (13). Archived from the original (PDF) on February 25, 2021. Retrieved 2014-11-03.
- ^ Jaylinn Herrera (November 12, 2022). "More Americans are living and working in Mexico. Where does that leave the locals?". NBC News website.
- ^ "Income and Poverty in the United States: 2020". Census.gov. Retrieved 2022-06-29.
- ^ Semega, Jessica; Chen, Frances; Kollar, Melissa; Shrider, Emily A. "Income and Poverty in the United States: 2021" (PDF). US CENSUS BUREAU. Retrieved 19 September 2022.
- ^ "Personal Income: PINC-03". US CENSUS BUREAU. Retrieved 29 June 2022.
- ^ "Historical Income Tables: Households". US CENSUS BUREAU. Retrieved 29 June 2022.
- ^ a b "S1501 – Educational Attainment". U.S. Census Bureau. Archived from the original on January 22, 2019. Retrieved October 17, 2019.
- ^ a b c d e f "DP03 – Selected Economic Characteristics". U.S. Census Bureau. Archived from the original on February 14, 2020. Retrieved October 17, 2019.
- ^ "Current Unemployment Rates for States and Historical Highs/Lows". U.S. Bureau of Labor Statistics.
- ^ a b c "Seasonally Adjusted Unemployment Rate". U.S. Dept. of Labor. Retrieved September 19, 2016.
- ^ "Employment Situation Summary". U.S. Dept. of Labor. July 2, 2015. Retrieved December 26, 2015.
- ^ "Table A-15. Alternative measures of labor underutilization". U.S. Bureau of Labor. Retrieved November 13, 2011.
- ^ Rickard, Stephanie J. (2020). "Economic Geography, Politics, and Policy". Annual Review of Political Science. 23: 187–202. doi:10.1146/annurev-polisci-050718-033649.
- ^ Schuman, H. and Scott, J. (1989), Generations and collective memories, American Sociological Review, vol. 54, 1989, pp. 359–81.
- ^ Deane, Claudia (15 December 2016). "Americans Name the 10 Most Significant Historic Events of Their Lifetimes". Pew Research Center. Retrieved 12 April 2019.
- ^ a b c d e Dimock, Michael (17 January 2019). "Defining generations: Where Millennials end and Generation Z begins". Pew Research Center. Retrieved 12 April 2019.
- ^ "People: The Younger Generation". Time. November 5, 1951. Archived from the original on September 13, 2012.
- ^ Miller, Jon D. "The Generation X Report: Active, Balanced, and Happy: These Young Americans are not bowling alone" (PDF). University of Michigan, Longitudinal Study of American Youth, funded by the National Science Foundation. Retrieved October 30, 2012.
- ^ Jackson, Ronald L. II, ed. (2010). Encyclopedia of Identity, Volume 1. Sage Publications. p. 307. ISBN 978-1-4129-5153-1.
- ^ "Baby Boomers - Year Range, Definition & Facts". June 7, 2019.
- ^ Tuttle, William M. (1993). "Daddy's Gone to War": The Second World War in the Lives of America's Children. Oxford University Press. p. 25. ISBN 978-0-195096491. Retrieved March 17, 2014.
- ^ "Census Bureau Releases 2021 CPS ASEC Geographic Mobility Data". U.S. Census Bureau. Retrieved 2022-03-03.
External links

Wikimedia Commons has media related to Demographics of the United States.
- United States Census Bureau
- New York Times: "Mapping the 2010 U.S. Census"
- 2000 Census of Population and Housing United States, U.S. Census Bureau
- Asian-Nation: Demographics of Asian American /2006-07-04-us-population_x.htm?csp=34 Countdown to 300 million
- Census Ancestry Map
- USA Today 2004 Election County by County Map
- Google – public data "Population in the U.S.A."