
Loading article…

粒子状物質または大気粒子状物質(他の名称については下記参照)は、空気中に浮遊する固体または液体の微小な 粒子です。エアロゾルという用語は、通常、粒子状物質単独ではなく、粒子と空気の混合物を指します。 [1]粒子状物質の発生源は、自然または人為的です。[2]それらは気候や降水に影響を与え、直接吸入以外の方法で人間の健康に悪影響を及ぼします。
大気中の粒子の種類には、浮遊粒子状物質、呼吸可能な粒子、[3] PM 10と呼ばれる直径10マイクロメートル(μm)以下の吸入可能な粗 粒子、PM 2.5と呼ばれる直径2.5μm以下の微粒子、[4] 100nm以下の超微粒子、およびすすなどがあります。
大気中の粒子状物質はグループ1の発がん性物質です。[5]粒子状物質は(超微粒子以外では)大気汚染の中で最も有害な形態です。 [6]粒子状物質は血流から肺や脳の奥深くまで浸透し、心臓病、肺疾患、がん、早産などの健康問題を引き起こします。[7]粒子状物質に安全なレベルはありません。世界中で、2016年にはPM 2.5への曝露により、心臓病、脳卒中、肺がん、慢性肺疾患、呼吸器感染症で410万人が死亡しました。[8]全体として、大気中の粒子状物質は世界的に早死の主な危険因子の1つです。[9]
出典

人間の活動により、大量の粒子が発生します。例:
- 化石燃料(航空機など)の燃焼[10] [11] [12] お札[13] [ 14] [15]廃棄物[16] 爆竹[17]および木材[18]や作物残渣などのバイオマスの燃焼。
- 建設(建物の改修・改築または解体工事を含む)[19] [20] [21] [22]
- 改修[ 23 ] [24] [25]
- 道路工事、重機からのディーゼル排気ガス、建築資材の生産からの排出物など[26] [27] [28] [29]
- 清掃されていない、または適切に覆われていない粉塵物質(例:建設現場、埋立地、陶磁器生産施設、焼却または山火事で残った灰)。[30] [31] [32]
- 金属加工(例:溶接)[33]
- 木工[ 34 ] [35]
- ガラスの再加工。
- 産業[4 ]
- 調理(揚げる、煮る、焼く)[36]
- 農業活動(例:耕作、土壌耕作)[37]
- 発電所[ 38]
- 廃棄物の焼却[ 39] [40]
- タイヤや道路の摩耗による道路の粉塵[41]と未舗装道路からの道路の粉塵[42] 。
- 冷却システム内の湿式冷却塔。
- 鉱業[43] [44] 製錬[45]石油精製[46]などの様々な産業プロセス。
- 災害[47](自然災害または人為的災害、例:山火事、地震、戦争、[48] [49]および9月11日の同時多発テロなど)。
- マイクロプラスチック(空気中のPMの一種として注目されている)。[50] [51]
灰、ガラス、プラスチック、特定の人工繊維から出る粉塵など、もろくて簡単に壊れる(「増殖する」)粉塵の中には、人間にとってより大きな脅威や刺激を与えるものがあります。鋭い角を持つ粉塵はさらに問題となる可能性があります。粒子の数、形状、粘着性なども、気象条件によって変化することがあります。
2010年の推定によると、人為的(人為的)エアロゾルは大気中のエアロゾル総質量の約10%を占めています。残りの90%は火山、砂嵐、森林火災や草原火災、生きている植物や海水のしぶきなどの自然発生源から発生し、火山灰、砂漠の塵、すす、海塩などの粒子状物質を放出します。[52]
家庭での燃焼と木の煙
英国では、家庭での燃焼が年間のPM 2.5とPM 10の最大の発生源であり、2019年には密閉式ストーブと直火の両方での家庭での薪燃焼がPM 2.5の38%を占めました。 [53] [54] [55]この問題に対処するために、2021年からいくつかの新しい法律が導入されました。ニューサウスウェールズ州のいくつかの町や都市では、冬の微粒子大気汚染の60%が薪の煙によるものと考えられます。[56]
薪の煙を減らすには、適切な薪ストーブを購入して適切にメンテナンスすること、[57] 、適切な薪を選ぶこと[58]、適切な方法で燃やすこと[59]など、いくつかの方法があります。また、一部の国では、人々が煙による汚染を地方自治体に報告できる規制もあります。 [60]
構成
赤/オレンジ:砂漠(鉱物)の塵、
青:海塩、
緑:煙
、白:硫酸塩粒子[61] [62]
粒子を含むエアロゾルの組成と毒性は、その発生源と大気の化学組成に依存し、大きく異なります。風で運ばれた鉱物粉塵[63]は、鉱物酸化物や地殻から吹き飛ばされた他の物質でできている傾向があり、この粒子は光を吸収します。[64]海塩[65]は、世界のエアロゾル収支で2番目に大きな要因であると考えられており、主に海水のしぶきに由来する塩化ナトリウムで構成されています。大気中の海塩の他の成分は海水の組成を反映しており、マグネシウム、硫酸塩、カルシウム、カリウムなどが含まれます。さらに、海水のしぶきのエアロゾルには、脂肪酸や糖などの有機化合物が含まれており、化学的性質に影響を与えます。[66]
二次粒子には、硫黄酸化物や窒素酸化物などの一次ガスが硫酸(液体)や硝酸(気体)に酸化されて生成されるものや、生物起源の排出物から生成されるものがあります。これらのエアロゾルの前駆物質、つまりエアロゾルの発生源となるガスは、人為起源(バイオマスや化石燃料の燃焼)と自然起源のものがあります。アンモニアが存在する場合、二次エアロゾルはアンモニウム塩の形をとることが多く、硫酸アンモニウムや硝酸アンモニウム(どちらも乾燥または水溶液の場合があります)となります。アンモニアが存在しない場合、二次化合物は硫酸(液体エアロゾル液滴)や硝酸(大気ガス)などの 酸性の形をとります。
二次硫酸塩エアロゾルと硝酸塩エアロゾルは強い光散乱体である。[67]これは主に硫酸塩と硝酸塩の存在によりエアロゾルが光を効果的に散乱する大きさにまで増加するためである。
エアロゾルに含まれる有機物(OM)は一次的なものと二次的なものがあり、後者は揮発性有機化合物(VOC)の酸化から生じます。大気中の有機物は生物起源のものでも人為起源のものでもかまいません。有機物は散乱と吸収の両方によって大気の放射場に影響を与えます。一部のエアロゾルは強い光吸収物質を含むと予測されており、大きな正の放射強制力を生み出すと考えられています。内燃機関の燃焼生成物から生じる二次有機エアロゾル(SOA)の中には、健康に対する危険があることが判明しています。[68]粒子の毒性は地域や粒子の化学組成に影響を与える発生源によって異なることが分かっています。
エアロゾルの化学組成は、それが太陽放射とどのように相互作用するかに直接影響します。エアロゾル内の化学成分は、全体的な屈折率を変えます。屈折率によって、光がどれだけ散乱し、吸収されるかが決まります。
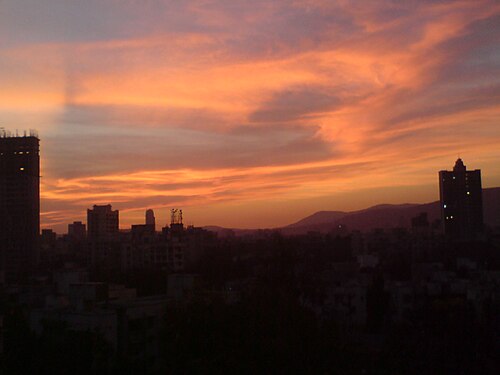
一般的に視覚効果であるヘイズを引き起こす粒子状物質の成分は、二酸化硫黄、窒素酸化物、一酸化炭素、鉱物粉塵、有機物から構成されています。粒子は硫黄の存在により吸湿性があり、湿度が高く気温が低いとSO2が硫酸塩に変換されます。これにより視界が低下し、赤橙黄色になります。[69]
サイズ分布
粒子状汚染などの人為的に生成されたエアロゾルは、自然起源のエアロゾル粒子(風で運ばれた塵など)よりも半径が小さい傾向があります。右側のエアロゾル粒子の分布図の擬似カラー マップは、月ごとに自然エアロゾル、人為的汚染、またはその両方の混合が存在する場所を示しています。
北部ではエアロゾルが減少
サイズ分布の時系列を見ると、地球の最南端の緯度ではほぼすべてのエアロゾルが大きいが、北半球の高緯度ではより小さなエアロゾルが非常に豊富であることが分かる。南半球のほとんどは海で覆われており、エアロゾルの最大の供給源は乾燥した海水のしぶきからできる天然の海塩である。陸地は北半球に集中しているため、火災や人間の活動による小さなエアロゾルの量は南半球よりも北半球の方が多くなっている。陸上では、大きな半径のエアロゾルの斑点が砂漠や乾燥地域に現れ、最も顕著なのは北アフリカのサハラ砂漠とアラビア半島で、砂嵐がよく発生する。人為的または自然の火災活動が頻繁に発生する場所(たとえば、8月から10月にかけてアマゾンで発生する土地開拓火災や、北半球の夏にカナダ北部の森林で発生する落雷による火災)では、より小さなエアロゾルが優勢である。人間が作り出した(化石燃料による)汚染は、特に夏季に米国東部やヨーロッパなどの先進地域に広がる小さなエアロゾルの大部分の原因となっている。[70] [より良い情報源が必要]
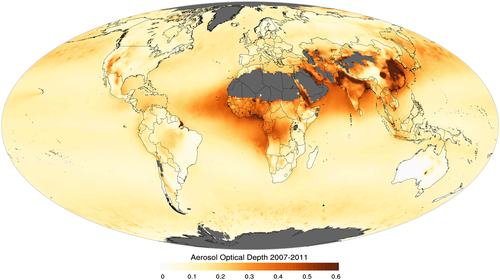
衛星によるエアロゾルの測定はエアロゾル光学的厚さと呼ばれ、粒子が大気の可視光線と赤外線の反射と吸収の仕方を変えるという事実に基づいています。このページに示されているように、光学的厚さが 0.1 未満 (最も薄い黄色) の場合は、視界が最大となる澄み切った空を示し、1 の値 (赤褐色) の場合は、非常に霞んだ状態を示します。[より適切な情報源が必要]
堆積プロセス
一般的に、粒子が小さく軽いほど、空気中に長く留まります。大きな粒子(直径10マイクロメートル以上)は、重力によって数時間で地面に沈む傾向があります。最小の粒子(1マイクロメートル未満)は、大気中に数週間留まることができ、ほとんどが降水によって除去されます。エアロゾルが「海を越えて移動できる」という証拠があります。たとえば、2017年9月、米国西部とカナダで山火事が燃え、その煙は3日間で英国と北フランスに到達したことが衛星画像で確認されています。[71] ディーゼル粒子状物質は、排出源の近くで最も高くなります。[72] DPMと大気、植物、高度、主要な発生源からの距離に関する情報は、健康への影響を判断するのに役立ちます。
コントロール
テクノロジー
粒子状物質の排出は、ほとんどの先進国で厳しく規制されています。環境への配慮から、ほとんどの産業では何らかの集塵システムの運用が義務付けられています。[73]これらのシステムには、慣性集塵機(サイクロン式分離機)、布製フィルター集塵機(バグハウス)、フェイスマスクに使用される静電フィルター、[74] 湿式スクラバー、静電集塵機などがあります。
サイクロン式分離器は、大きくて粗い粒子を除去するのに役立ち、他のより効率的な集塵機の第一段階または「前処理装置」としてよく使用されます。適切に設計されたサイクロン式分離器は、微細な粒子の除去にも非常に効果的であり、[75]メンテナンスのために頻繁に停止することなく連続的に動作させることができます。[要出典]
布製フィルターまたはバグハウスは、一般産業で最も一般的に使用されています。[76]これらは、ほこりを含んだ空気を袋状の布製フィルターに通して、粒子を袋の外側の表面に集め、きれいになった空気を通過させて大気中に排出するか、場合によっては施設内に再循環させるという仕組みです。一般的な布地にはポリエステルやグラスファイバーがあり、一般的な布地コーティングにはPTFE(一般にテフロンとして知られています)があります。余分なほこりの蓄積は袋から取り除かれ、コレクターから取り除かれます。
湿式スクラバーは汚れた空気を洗浄液(通常は水と他の化合物の混合物)に通して、粒子を液体分子に付着させます。[85]静電集塵機は、汚れた空気が通過するときに帯電します。帯電した空気は大きな静電プレートを通過し、空気流中の帯電粒子を引き寄せて集め、きれいな空気として排出または再循環されます。[86]
対策
一般的な建築工事では、数十年にわたって建設粉塵の健康被害の可能性を認識してきた場所の中には、関連する請負業者に効果的な粉塵制御対策を講じることを法的に義務付けているところもあるが、近年では検査、罰金、懲役はほとんど行われていない(例えば、2021年に香港で総額6,000香港ドルの罰金を伴う起訴が2件あった)。[87] [88]
義務的な粉塵抑制対策には、[89] [84] [90] [91] セメントまたは乾燥粉砕燃料灰の積み込み、積み下ろし、取り扱い、移動、保管または処分は完全に密閉されたシステムまたは施設で行う、通気口または排気口には効果的な布製フィルターまたは同等の大気汚染防止システムまたは機器を取り付ける、建物の足場を粉塵スクリーンで囲む、資材ホイストと瓦礫シュート両方を不浸透性のシートで囲む、瓦礫を瓦礫シュートに捨てる前に水で濡らす、研削作業の前と作業中にファサード表面に水を噴霧する、ファサード研削作業には掃除機付きのグラインダーを使用する、空気圧または動力駆動による穴あけ、切断、研磨、または粉塵放出の原因となるその他の機械的破壊作業の際には表面に継続的に水を噴霧する(ただし、効果的な粉塵抽出および濾過装置が稼働している場合を除く)、敷地境界の全長にわたって高さ 2.4 メートル以上の囲いを設ける、空き地に硬い舗装を施す、作業に使用したすべての車両を洗浄する、などがある。建設現場を離れる際は、自動スプリンクラー設備、自動洗車設備、汚染防止施設のビデオ監視システムを使用し、将来の検査のためにビデオを 1 か月間保管します。
汚染源から粒子を除去する以外にも、粒子は屋外で除去されることもある(例:スモッグタワー、モスウォール、ウォータートラック)[92] 。一方、他の制御手段ではバリアの使用が採用されている。[93]
測定
20世紀初頭に大気汚染が初めて体系的に研究されて以来、粒子状物質の測定方法はますます洗練されてきました。初期の方法には、煙突からの排出物を視覚的に比較できる灰色の網掛けのカードである比較的粗いリンゲルマンチャートや、特定の場所に堆積した煤を集めて重量を測る堆積物ゲージなどがありました。粒子状物質を測定する自動化された現代の方法には、光学式光検出器、テーパードエレメント振動式微量天秤、エサロメーターなどがあります。[94]単位体積あたりの粒子の総質量(粒子質量濃度)を測定することに加えて、単位体積あたりの粒子の総数(粒子数濃度)を測定する方が有用な場合があります。これは、凝縮粒子カウンター(CPC)を使用して行うことができます。[95] [96]
粒子サンプルの原子組成を測定するには、X線分光法などの技術を使用することができます。[97]
気候の影響
_-_global_warming.svg/500px-20231206_Radiative_forcing_(warming_influence)_-_global_warming.svg.png)
大気エアロゾルは、地球システムに保持される入射太陽放射と放射される地上長波放射 の量を変化させることで、地球の気候に影響を与えます。これは、直接的、間接的[99] [100]および半直接的なエアロゾル効果に分けられるいくつかの異なるメカニズムを通じて発生します。エアロゾル気候効果は、将来の気候予測における最大の不確実性の原因です。[101]気候変動に関する政府間パネル(IPCC)は2001年に次のように述べています。[102]
温室効果ガスによる放射強制力はかなり高い精度で決定できるかもしれないが、エアロゾル放射強制力に関する不確実性は依然として大きく、現時点では検証が困難な地球規模のモデリング研究からの推定値に大きく依存している。
エアロゾル放射
直接
エアロゾルの直接効果は、吸収や散乱など、放射と大気エアロゾルとの直接的な相互作用から成ります。これは、短波放射と長波放射の両方に影響を及ぼし、正味の負の放射強制力を生み出します。[103]エアロゾルの直接効果による結果として生じる放射強制力の大きさは、下層表面のアルベドに依存します。これは、アルベドが吸収または宇宙に散乱される放射の正味量に影響するためです。たとえば、散乱率の高いエアロゾルが低アルベドの表面の上にある場合、高アルベドの表面の上にある場合よりも放射強制力が大きくなります。吸収エアロゾルの場合はその逆で、高アルベドの表面上にある吸収率の高いエアロゾルから最大の放射強制力が生じます。[99]エアロゾルの直接効果は一次効果であるため、IPCCでは放射強制力として分類されています。[101]エアロゾルと放射線の相互作用は、単一散乱アルベド(SSA)によって定量化されます。これは、粒子による放射線の散乱のみと散乱プラス吸収(消散)の比率です。散乱が優勢で吸収が比較的少ない場合、SSAは1に近づく傾向があり、吸収が増加するにつれて減少し、無限の吸収の場合はゼロになります。たとえば、海塩エアロゾルのSSAは1です。これは、海塩粒子が散乱のみであるためです。一方、すすのSSAは0.23であり、すすが大気エアロゾルの主要な吸収体であることを示しています。[要出典]
間接的
間接的なエアロゾル効果は、大気中のエアロゾルによる雲の変化によって地球の放射収支に生じる変化であり、いくつかの異なる効果から成ります。雲滴は、雲凝結核(CCN)と呼ばれる既存のエアロゾル粒子上に形成されます。粒子状汚染物質に見られるような人為的に生成されたエアロゾルの周囲に凝縮する液滴は、自然起源のエアロゾル粒子(風で運ばれた塵など)の周囲に形成される液滴よりも小さく、数が多くなる傾向があります。[52]
どのような気象条件でも、CCNの増加は雲粒数の増加につながります。これにより短波放射の散乱が大きくなり、雲のアルベドが増加します。これは雲アルベド効果、第一次間接効果、またはTwomey効果として知られています。[100]雲アルベド効果を裏付ける証拠は、船舶の排気ガス[104]とバイオマス燃焼[105]が周囲の雲と比較した雲アルベドに与える影響から観察されています。雲アルベドエアロゾル効果は一次効果であるため、IPCCによって放射強制力として分類されています。[101]
エアロゾルの導入による雲滴数の増加は、同じ量の水がより多くの滴に分割されるため、雲滴サイズを縮小する働きをする。これは降水量を抑制し、雲の寿命を延ばす効果があり、雲寿命エアロゾル効果、第2間接効果、またはアルブレヒト効果として知られている。[101]これは、周囲の雲と比較して船舶の排気煙の霧雨が抑制されることとして観察されており、[106]バイオマス燃焼煙の降水が抑制されている。[107]この雲寿命効果は、水循環との相互依存性のため、IPCCによって(放射強制ではなく)気候フィードバックとして分類されている。[101]ただし、以前は負の放射強制として分類されていた。[108]
半直接
半直接効果は、直接効果として分類される直接散乱および吸収以外の、すすなどの吸収性大気エアロゾルによって引き起こされる放射効果に関係する。これは多くの個別のメカニズムを包含し、一般に直接および間接エアロゾル効果よりも定義および理解が不十分である。たとえば、吸収性エアロゾルが大気の上層部に存在する場合、周囲の空気を加熱して水蒸気の凝結を抑制し、雲の形成を減少させることができる。[109]さらに、地表に対して大気の層を加熱すると、大気の対流が抑制されるため、より安定した大気となる。これにより、対流による水分の上昇が抑制され、[110]雲の形成が減少する。上空の大気の加熱は地表の冷却にもつながり、地表水の蒸発が減少する。ここで説明した効果はすべて、雲量の減少、すなわち惑星のアルベドの増加につながる。この半直接効果は、水循環との相互依存性のため、IPCCによって気候フィードバックとして分類されている。[101]しかし、以前は負の放射強制力として分類されていた。[108]
エアロゾルの特定の役割
硫酸塩
硫酸エアロゾルは、主に(SO 4 2- )、HSO 4 -、H 2 SO 4 -などの無機 硫黄化合物であり[111]、主に二酸化硫黄が水蒸気と反応して硫酸ガスとさまざまな塩を形成するときに生成されます(多くの場合、雲の中での酸化反応による)。その後、吸湿性の成長と凝固を経て、蒸発によって収縮すると考えられています。[112] [113]それらのいくつかは生物起源(主に海洋プランクトンからのジメチルスルフィドとの大気中の化学反応によって生成されます[114])、火山経由の地質学的、または山火事やその他の自然燃焼イベントによる天候駆動型ですが、[113]ここ数十年は、硫黄含有量の高い化石燃料、主に石炭と、航空燃料やバンカー燃料などの特定の精製度の低い燃料の燃焼によって生成される人為起源の硫酸エアロゾルが主流でした。[115] 1990年までに、大気中への人為的硫黄排出量は、硫黄含有化合物の自然排出量の合計と「少なくとも同程度」になり、ヨーロッパと北米の最も汚染された地域の自然エアロゾルの少なくとも10倍になり、[116]それらの地域では、それらが全大気汚染の25%以上を占めました。[117]これにより酸性雨が発生し、[118] [119]心臓や肺の病気にもつながり、[117]早産や低出生体重のリスクにもつながりました。[120]硫酸塩汚染はNOx汚染やオゾンとも複雑な関係があり、同様に有害な地上オゾンを減少させますが、成層圏オゾン層にもダメージを与える可能性があります。 [121]
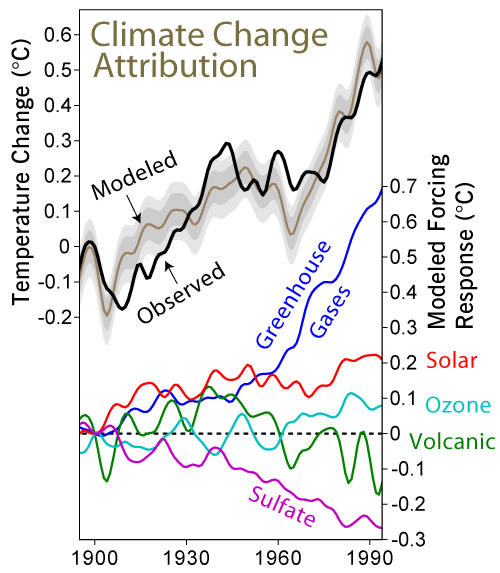
問題が明らかになると、排ガス脱硫対策やその他の汚染制御を通じてこの汚染を除去する取り組みが大成功を収め、[122]汚染の蔓延を53%削減し、米国だけで年間500億ドル相当の医療費を節約しました。 [123] [117] [124]しかし、同じ時期に、硫酸エアロゾルが地球が受ける可視光と表面温度の両方に影響を及ぼしていることが研究で示され、[125]いわゆる地球暗化が1990年代に人為的な硫酸塩汚染の減少に沿って逆転し始めたため、 [126] [127] [128]気候変動が加速しました。[129] 2021年現在、最先端のCMIP6モデルでは、現在存在するエアロゾルによる総冷却は0.1 °C(0.18 °F)から0.7 °C(1.3 °F)の間であると推定されています。[130] IPCC第6次評価報告書では0.5℃(0.90℉)という最良の推定値が使用されているが、[131]この不確実性は主に雲のエアロゾルの影響に関する研究が矛盾していることに起因する。[132] [133] [134] [135] [136] [137]しかし、雲のエアロゾルが地球を冷やすことを確信している者もおり、これが成層圏エアロゾル注入と呼ばれる太陽地理工学の提案につながった。これは、成層圏に配備することで硫酸塩汚染による冷却を再現・強化するとともに健康への悪影響を最小限に抑えることを目指しており、成層圏では現在の硫黄汚染のほんの一部で数度の温暖化を防ぐことができる。[138]しかし、費用と便益の評価は不完全なままであり、[139] 2020年代初頭までにこのテーマに関する何百もの研究が完了したにもかかわらずである。[140]
ブラックカーボン
ブラックカーボン(BC)、カーボンブラック、元素状炭素(EC)は、しばしばすすとも呼ばれ、純粋な炭素クラスター、スケルトンボール、フラーレンで構成され、大気中の最も重要な吸収エアロゾル種の1つです。有機炭素(OC)とは区別する必要があります。有機炭素は、クラスター化または凝集した有機分子自体、またはECバッキーボールに浸透しています。化石燃料からのブラックカーボンは、IPCCの第4次評価報告書(4AR)で、+0.1~+0.4 W/m 2の範囲で、+0.2 W/m 2 ( IPCCの第2次評価報告書(SAR)では+0.1 W/m 2 )の全球平均放射強制力に寄与すると推定されています。しかし、2013年に発表された研究では、「産業革命時代(1750年から2005年)の大気中のブラックカーボンの直接放射強制力の最良の推定値は+0.71 W/m 2で、90%の不確実性境界は(+0.08、+1.27)W/m 2である」と述べ、「産業革命前の背景を差し引かないブラックカーボン源による総直接強制力は+0.88(+0.17、+1.48)W/m 2と推定される」としている。[141]
インスタンス

火山はエアロゾルの大きな自然発生源であり、地球の気候の変化と関連付けられており、しばしば人類に影響を及ぼす。気候の変化に関連する噴火には、1601年から1603年のロシア飢饉と関連付けられ、[142] [143] [144] 200万人の死者を出した1600年のワイナプチナ火山の噴火や、数年にわたって約0.5℃の地球寒冷化を引き起こした1991年のピナツボ火山の噴火などがある。 [145] [146] 2000年と2010年の成層圏における光散乱エアロゾルの影響を追跡し、そのパターンを火山活動と比較した研究では、密接な相関関係が示された。人為的粒子の影響のシミュレーションでは、現在のレベルではほとんど影響が見られなかった。[147] [148]
エアロゾルは地域規模で天候や気候にも影響を及ぼすと考えられている。インドモンスーンの衰退は、人為的エアロゾルの半直接的な影響によるインド洋からの水の蒸発抑制と関連している。 [149]
サヘルの干ばつ[150]と、1967年以降オーストラリアのノーザンテリトリー、キンバリー、ピルバラ、ヌラーボー平原周辺での降雨量の大幅な増加に関する最近の研究から、一部の科学者は、南アジアと東アジアのエアロゾルヘイズが両半球の熱帯降雨量を着実に南に移動させていると結論付けています。 [149] [151]
健康への影響

サイズ、形状、溶解度が重要
サイズ
粒子の大きさは、吸入されたときに気道のどこに留まるかを決定する主な要因です。より大きな粒子は通常、鼻と喉で繊毛と粘液によって濾過されますが、約10マイクロメートル未満の粒子状物質は気管支と肺に沈着して健康上の問題を引き起こす可能性があります。10マイクロメートルのサイズは、呼吸可能な粒子と呼吸不可能な粒子の厳密な境界を表すものではありませんが、ほとんどの規制機関が空気中のPMの監視に同意したものです。粒子の大きさが小さいため、10マイクロメートル以下の粒子(粗粒子状物質、PM 10 )は、細気管支や肺胞などの肺の最も深い部分に浸透する可能性があります。[152]喘息患者がこれらの条件にさらされると、気管支収縮を引き起こす可能性があります。[153]
同様に、微粒子物質(PM 2.5)は肺のガス交換領域(肺胞)に浸透する傾向があり、非常に小さな粒子(超微粒子物質PM 0.1)は肺を通過して他の臓器に影響を及ぼす可能性があります。粒子の浸透はサイズだけに依存するわけではなく、形状と化学組成も関係しています。この複雑さを回避するために、PM 粒子の心臓血管系への相対的な浸透の程度を示す簡単な命名法が使用されています。吸入可能な粒子は繊毛によって濾過されるため、気管支より先には浸透しません。胸部の粒子は終末細気管支にまで浸透する可能性があります。
同様に、吸入可能な粉塵分は鼻や口から入り、呼吸器のどこにでも沈着する可能性のある粉塵分です。胸部分は胸部に入り、肺の気道内に沈着する分です。呼吸可能な分はガス交換領域(肺胞)に沈着する分です。[154]
最も小さい粒子であるナノ粒子は、大きさが180ナノメートル未満であり、心臓血管系にさらにダメージを与える可能性があります。[155] [156]ナノ粒子は細胞膜を通過し、脳を含む他の臓器に侵入する可能性があります。現代のディーゼルエンジンから排出される粒子(一般にディーゼル粒子状物質、またはDPMと呼ばれる)の大きさは、通常100ナノメートル(0.1マイクロメートル)の範囲です。これらのすす粒子には、表面に吸着されたベンゾピレンなどの発がん性物質も含まれています。
粒子質量は健康被害の適切な尺度ではない。直径10μmの粒子は、直径100nmの粒子100万個とほぼ同じ質量であるが、肺胞に入る可能性は低いため、危険性ははるかに低い。したがって、質量に基づくエンジン排出ガスの法的制限は保護的ではない。いくつかの国では新しい規制の提案があり、[どの国? ]代わりに粒子表面積または粒子数(数値)/粒子数濃度(PNC)を制限することを提案している。[157] [158]
溶解度
吸入したガスや蒸気の吸収場所と吸収量は、水への溶解度によって決まります。吸収は、空気の流量と吸入した空気中のガスの分圧にも依存します。特定の汚染物質の運命は、その存在形態(エアロゾルまたは粒子)に依存します。吸入は、被験者の呼吸速度にも依存します。[159]
形
完全に文書化されていないもう1つの複雑な点は、肺に留まる可能性のある針状のアスベスト繊維を除いて、PMの形状が健康にどのような影響を与えるかということです。幾何学的に角張った形状は丸い形状よりも表面積が広く、それが粒子と他の、おそらくより危険な物質との結合能力に影響を与えます。[要出典]以下の表は、一般的な大気中の粒子の色と形状を示しています。[160]
粒子の走査型電子顕微鏡
-
 ガラス瓶由来のガラス粉末の走査型電子顕微鏡観察
 -
 セメントの走査型電子顕微鏡
 -
 繊維状の構造を持つと思われるモルタルガラス粉末(10%)の走査型電子顕微鏡写真
 -
 針状繊維を有する白色アスベストの走査型電子顕微鏡写真
構成、量、期間が重要
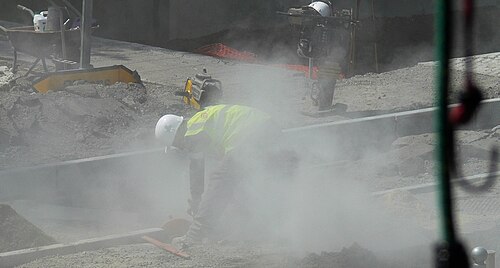
粒子の組成は、その発生源や生成方法によって大きく異なります。例えば、生きている植物や枯れた植物を燃やして発生する粉塵は、お香や建築廃棄物を燃やして発生する粉塵とは異なります。燃料の燃焼から発生する粒子は、廃棄物の燃焼から発生する粒子とは異なります。リサイクル場[161]やスクラップ金属を満載した船[162] [163]の火災から発生する粒子状物質には、他の種類の燃焼よりも多くの毒性物質が含まれている可能性があります。
建物の改修作業の種類によっても、発生する粉塵の種類は異なります。ポルトランドセメントで作られたコンクリートを切断または混合することで発生するPMの組成は、異なる種類のスラグ(GGBFS、EAFスラグ[164]など)、フライアッシュ、さらにはEAFダスト(EAFD)[165]で作られたコンクリートを切断または混合することで発生するPMの組成とは異なりますが、EFAD、スラグ、フライアッシュは重金属を含んでいるため、より 有毒である可能性があります。環境に優しい製品として販売および使用されているスラグセメント[166] [167] [168]のほかに、異なる種類のスラグ、フライアッシュ、またはその他の不明な物質が添加された偽造(混ぜ物)セメントも、生産コストがはるかに低いため、一部の地域では非常に一般的です[169] [ 170] 。品質[171]と毒性の問題に対処するため、一部の地域では、建物に使用されるセメントへのEAFスラグの使用を禁止し始めています。[173]溶接煙の成分も大きく異なり、溶接される材料に含まれる金属、コーティングや電極の成分などによって左右されるため、さまざまな種類の有毒ガスの排出によって、多くの健康問題(鉛中毒、金属煙熱、がん、吐き気、炎症、腎臓や肝臓の損傷、中枢神経系の問題、喘息、肺炎など)を引き起こす可能性があります。[174]
研究によると、中国の人々の血中鉛濃度は大気中のPM2.5濃度や表土の鉛含有量と高い相関関係にあることがわかっており、空気と土壌(例えば、再浮遊した土壌粒子の吸入、汚染された作物や水の摂取など)が鉛への曝露の重要な発生源であることを示している。[175] [176]
成分以外にも、曝露量や曝露期間も重要であり、これらは病気の誘発や重症度に影響を与える。屋内に侵入した粒子は、室内の空気の質に直接影響を与える。三次喫煙に似た二次汚染の可能性も懸念される。[177] [178]
一言で言えば、背景濃度は重要ですが、「空気の質の改善」や「PMの環境濃度の低下」だけでは、必ずしも健康状態が良くなるわけではありません。健康への影響は、主に人がさらされる粒子状物質の毒性(または発生源[179])、さらされる量と時間、そしてPMの大きさ、形状、溶解度に依存します。
建設工事や改修工事は粒子状物質の顕著な発生源であるため、一部の地域では非常に一般的なそのような工事[180] [181]は、すでに着工して稼働している医療施設では可能な限り避けるべきである。避けられない工事については、PM排出に関するより良い計画と緩和策を導入すべきである。電動工具、重機、ディーゼル燃料、潜在的に有毒な建築資材(コンクリート、金属、はんだ、塗料など)の使用は、病気の治療や生存の機会を求めている患者に悪影響が及ばないように厳密に監視されるべきである。
健康上の問題


粒子状物質の吸入による影響はヒトと動物で広く研究されており、COVID-19、[182] [183] [184] [185] [186]、 喘息、肺がん、珪肺症などの呼吸器疾患、 [187] [188]、心血管疾患、早産、先天異常、低出生体重、発達障害、[189] [190] [191] [192]、神経変性疾患[193] [194]、精神障害、[195] [196] [197]、早死になどがある。直径2.5ミクロン未満の屋外の微粒子は、世界中で年間420万人の死者と1億300万以上の障害調整生存年の損失の原因となっており、死亡の5番目に多い危険因子となっている。大気汚染は、他のさまざまな心理社会的問題とも関連付けられている。[196]粒子状物質は臓器に直接侵入して組織損傷を引き起こす可能性があり、また全身性炎症によって間接的に組織損傷を引き起こす可能性がある。安全とされる公表された大気質基準よりも低い曝露レベルであっても、悪影響が生じる可能性がある。[198] [199]
主な危険物としての人為的微粒子
人為的な粒子状大気汚染の結果としての空気中の微粒子レベルの上昇は、 「肺がん[200]やその他の心肺疾患による 死亡率など、最も深刻な影響と一貫して独立して関連している」。[201]多数の死亡者数[202]とその他の健康問題および粒子状汚染との関連性は、1970 年代初頭[203]に初めて実証され、それ以来何度も再現されてきました。 PM 汚染は、米国で年間 22,000~52,000 人の死因となっていると推定されています (2000 年以降) [204]。2005 年にはヨーロッパで約 370,000 人の早期死亡につながりました。 [205]また、世界疾病負荷共同研究によると、2010 年には世界で 322 万人が死亡しました。[206]欧州環境機関の調査によると、2019年にEU加盟27か国で微粒子汚染により30万7000人が早死にしたと推定されている。[207]
2000年に米国で実施された研究では、微粒子状物質が粗粒子状物質よりも有害である可能性が調査されました。この研究は6つの異なる都市を対象としていました。彼らは、空気中の粒子状物質によって引き起こされた死亡と病院への受診は、主に微粒子状物質によるものであることを発見しました。[208]同様に、1987年の米国の大気汚染データの研究では、粗粒子とは対照的に、微粒子と硫酸塩が標準的な大都市統計区域の年間総死亡率と最も一貫して有意に相関していることがわかりました。[209]
2022年にGeoHealthに掲載された研究では、米国でエネルギー関連の化石燃料排出をなくすことで、毎年46,900~59,400人の早期死亡を防ぎ、PM2.5関連の病気や死亡を回避することで5370~6780億ドルの利益が得られると結論付けています。 [ 210]
不妊、妊娠、胎児、先天異常
不妊率の上昇は粒子状物質への曝露と相関関係にある。[211]妊娠中の母親のPM2.5曝露も子供の高血圧と関連している。[212]
PM 2.5~PM 10の吸入は、低出生体重などの妊娠の悪影響のリスク上昇と関連している。[213] PM 2.5への曝露は、PM 10への曝露よりも出生体重の減少が大きいことがわかっている。[214] PMへの曝露は、炎症、酸化ストレス、内分泌かく乱、胎盤への酸素輸送障害を引き起こす可能性があり、[215]これらはすべて、低出生体重のリスクを高めるメカニズムである。[216]全体的な疫学的および毒物学的証拠は、PM 2.5への長期曝露と発達の結果(つまり、低出生体重)の間に因果関係があることを示唆している。[214]妊娠三半期特有の曝露の重要性を調査した研究は決定的なものではないことが証明されており、[217]国際的な研究の結果は、出生前の粒子状物質曝露と低出生体重との関連性を導くことにおいて一貫性がない。[214]周産期の結果は生涯にわたる健康と関連しており[218] [219]、粒子状物質への曝露は広範囲に及んでいるため、この問題は公衆衛生上極めて重要である。
心臓血管疾患および呼吸器疾患
PM 2.5は動脈にプラークを多く沈着させ、血管の炎症やアテローム性動脈硬化症を引き起こします。アテローム性動脈硬化症は動脈が硬くなり弾力性が低下し、心臓発作やその他の心血管疾患につながる可能性があります。 [220] 2014年のメタ分析では、粒子状物質への長期曝露が冠動脈イベントに関連していることが報告されました。この研究には、欧州大気汚染影響コホート研究(ESCAPE)に参加した11のコホートが含まれており、100,166人が平均11.5年間追跡されました。PM 2.5への推定年間曝露がわずか5 μg/m 3増加すると、心臓発作のリスクが13%増加しました。[221] PMは人間の細胞や組織に影響を与えるだけでなく、人間に病気を引き起こす細菌にも影響を与えます。[222] バイオフィルム形成、抗生物質耐性、および黄色ブドウ球菌と肺炎球菌のコロニー形成は、黒色炭素への曝露によって変化した。
直径2.5~10マイクロメートルの粗粒子汚染による急性健康影響に関する米国最大の研究は2008年に発表され、心血管疾患による入院との関連性が認められたが、呼吸器疾患による入院数との関連性を示す証拠はなかった。[223]微粒子レベル(PM 2.5以下)を考慮に入れると、粗粒子との関連性は残ったが、もはや統計的に有意ではなかった。つまり、その影響は微粒子のサブセクションによるものである。
モンゴル政府機関は、過去5年間で呼吸器疾患の発生率が45%増加したことを記録した(2011年の報告)。[224]気管支喘息、慢性閉塞性肺疾患、間質性肺炎は、この地域の病院で最も多く治療されている疾患である。早期死亡、慢性気管支炎、心血管疾患のレベルは急速に増加している。[69]
認知障害とメンタルヘルス
大気汚染と粒子状物質が認知能力に与える影響は、活発な研究分野となっている。[225]
大気汚染は発達障害(自閉症など)[189] [190] [191] [192]神経変性疾患[193] [194]精神疾患[195] [196] [197]自殺[195] [197] [226]のリスクを高める可能性があるが、うつ病と一部の大気汚染物質との関連に関する研究は一貫していない。[227]少なくとも1つの研究では、「都市の空中浮遊粒子状物質(PM)に豊富に存在する燃焼および/または摩擦による加熱によって形成された高温の磁鉄鉱ナノ球と正確に一致する磁鉄鉱ナノ粒子が人間の脳に豊富に存在する」ことが確認されている。 [228]
微粒子はアルツハイマー病や早期脳老化の発症にも関与しているようです。PM 2.5への曝露とアルツハイマー病などの神経変性疾患の罹患率との相関関係を示す証拠が増えています。いくつかの疫学研究では、PM 2.5への曝露と認知機能の低下、特にアルツハイマー病などの神経変性疾患の発症との関連が示唆されています。
地理空間分析技術を使用して、「NIEHS の資金提供を受けた研究者は、米国全土におけるパーキンソン病の症例と微粒子物質 (PM 2.5として知られている) との強い関連性を確認することができました。この研究では、パーキンソン病の発生率が高い地域では、一般的に PM 2.5のレベルが高く、その発生源には自動車、山火事、発電所などが含まれています。」[229] PM 2.5への曝露と認知機能低下の関連性の背後にある正確なメカニズムは完全には理解されていませんが、研究では、微粒子が嗅覚神経を通じて脳に入り、炎症や酸化ストレスを引き起こし、脳細胞を損傷し、神経変性疾患の発症に寄与する可能性があることが示唆されています。[230]
死亡率の増加
世界保健機関(WHO)は2005年に「微粒子大気汚染(PM(2.5))は、世界中で心肺疾患による死亡の約3%、気管・気管支・肺の癌による死亡の約5%、5歳未満の子供の急性呼吸器感染症による死亡の約1%の原因となっている」と推定した。[231] 2011年の研究では、交通排気ガスが一般市民の心臓発作の最も深刻な予防可能な原因であり、心臓発作全体の7.4%の原因であると結論付けられた。[232]
2008年にタイのバンコクで行われた粒子状物質の研究では、1立方メートルあたり10マイクログラムごとに心血管疾患による死亡リスクが1.9%、全疾患リスクが1.0%増加することが示された。レベルは1996年の平均が65、2002年が68、2004年が52であった。レベルが低下したのは、ディーゼル燃焼から天然ガス燃焼への転換と規制の改善によるものと考えられる。[233]
人種間の格差
人種と粒子状物質との近接性、ひいては長期曝露による健康への悪影響との関連を示す研究は数多くある。米国のある研究では、「ある地域における黒人居住者の割合は、喘息の発症率の高さと関連していた」と示されている。 [234]多くの学者は、この不均衡を人種による住宅分離と「有毒物質への曝露」におけるそれぞれの不平等と関連づけている。[234]この現実は、「医療は、より広範な歴史的および現代的な社会的、経済的不平等、およびアメリカ人の生活の多くの分野における根強い人種的、民族的差別の文脈で行われている」という発見によってさらに悪化している。[235]住宅が粒子状物質を排出する施設に近いと、PM 2.5 への曝露が増加し、罹患率および死亡率の上昇につながる。[236]複数の研究により、非白人および貧困層の人口では PM 排出の負担が大きいことが確認されているが、[236]収入がこれらの違いの原因ではないと言う人もいる。[237]人種と住宅関連の健康への影響との相関関係は、歴史的なレッドライン慣行に関連した長年の環境正義の問題に起因しています。これらの要因を文脈化した例として、ルイジアナ州南東部の、近隣の化学工場による癌関連死が集中していることから「キャンサー・アレー」と呼ばれる地域があります。 [238]キャンサー・アレーはアフリカ系アメリカ人が多数を占めるコミュニティであり、工場に最も近い地区は黒人が90%を占めています。[238]黒人人口は白人人口よりもPM排出量の多い地域に不釣り合いに近いという科学的物語を永続させています。2020年の記事では、高PM濃度での生活の長期的な健康への影響と、SARS-CoV-2またはCOVID-19のリスク、拡散、死亡率の増加を関連付け、この結果の原因は人種差別の歴史にあると非難しています。[238]
山火事の煙によるリスク
山火事が長引く地域では、粒子状物質への曝露のリスクが高まっています。山火事の煙は、高齢者、子供、妊婦、肺疾患や心血管疾患を患っている人など、敏感なグループに影響を及ぼす可能性があります。 [239]カリフォルニアの2008年の山火事シーズンでは、周囲の空気からの粒子状物質と比較して、好中球浸潤、細胞流入、浮腫の増加が観察されたため、粒子状物質が人間の肺に対してはるかに有毒であることがわかりました。 [240]さらに、山火事からの粒子状物質は、虚血性心疾患などの急性冠動脈イベントの誘発因子であることが示されています。[241]山火事は、粒子状物質への曝露による救急外来受診の増加や、喘息関連イベントのリスク増加とも関連しています。[242] [243]山火事からのPM2.5と心肺疾患による入院リスク増加との関連が発見されています。 [244]また、山火事の煙が精神的なパフォーマンスを低下させるという証拠もある。[245]
エネルギー産業に関する知識と健康への悪影響への対応

大手エネルギー会社は、少なくとも 1960 年代から、自社製品の使用が広範囲にわたる健康への悪影響や死亡を引き起こすことを理解していたが、米国やその他の地域でクリーン エア規制に反対する積極的な政治ロビー活動を続け、化石燃料の燃焼と人命への重大なリスクとの因果関係について疑念を植え付けるために、大規模な企業宣伝キャンペーンを開始した。社内メモによると、エネルギー業界の科学者や幹部は、化石燃料によって生成される大気汚染物質が人間の肺組織の奥深くに留まり、石油産業労働者の子供に先天性欠損症を引き起こすことを知っていた。業界メモは、自動車が「圧倒的に大気汚染の最大の原因」であり、大気汚染が健康への悪影響を引き起こし、発がん性物質を含む毒素を「喉で除去されるはずの」肺の奥深くに留まらせることを認めている。[247]
高まる国民の懸念に応えて、業界は最終的に業界ロビー団体である世界気候連合を結成し、大気汚染を規制しようとする政府の試みを阻止し、そのような規制の必要性について国民の意識に混乱を生じさせた。同様のロビー活動と企業広報活動は、石油・ガス業界の業界団体である米国石油協会と、気候変動否定論者の民間シンクタンクであるハートランド研究所によって行われた。「化石燃料業界の対応はいつも同じ手法だ。まず知って、次に計画し、次に否定し、そして遅らせる。彼らは遅延、巧妙な形のプロパガンダ、そして規制の弱体化に頼ってきた」と、化石燃料企業と気候変動の歴史を研究しているハーバード大学のジェフリー・スープラン氏は述べた。国際環境法センターのキャロル・マフェットなどの政策アナリストは、これらの取り組みを、タバコの喫煙とがんの因果関係に疑問を抱かせ、その規制を阻止するためにロビー活動や企業宣伝キャンペーンを行うタバコ業界の戦略に例えている。さらに、業界から資金援助を受けている擁護者たちは、米国政府の高官に任命されると、大気汚染の致命的な影響を示す科学的研究結果を改訂し、その規制を撤回した。 [247] [248] [249]
植生への影響
粒子状物質は植物の気孔を塞ぎ、光合成機能を阻害する可能性がある。[250]このように、大気中の粒子状物質の濃度が高いと、一部の植物種の成長阻害や死亡につながる可能性がある。[要出典]
規制
ほとんどの政府は、特定の種類の汚染源(自動車、産業排出物など)からの排出が許容される量と、粒子状物質の周囲濃度の両方について規制を設けています。IARCとWHOは、粒子状物質をグループ1の発がん性物質に指定しています。粒子状物質は、濾過されずに肺や血流の奥深くまで浸透し、呼吸器疾患、心臓発作、早期死亡を引き起こすため、大気汚染の中で最も致命的な形態です。[251] 2013年に、ヨーロッパ9か国の312,944人を対象に実施されたESCAPE調査では、粒子状物質に安全なレベルはなく、PM10が10 μg/m 3 増加するごとに肺がんの発生率が22%上昇することが明らかになりました。PM2.5では、10 μg/m 3ごとに肺がんの発生率が36%増加しました。[200] ESCAPEデータを含む世界中の18の研究を2014年にメタ分析したところ、PM2.5が10μg / m3増加するごとに肺がんの発生率は9%上昇した。[252]
政府によって設定された制限/基準
カナダ
カナダでは、粒子状物質の基準は、連邦・州レベルのカナダ環境大臣会議(CCME)によって全国的に定められています。管轄区域(州および準州)では、より厳しい基準が定められる場合があります。 2015年現在、粒子状物質2.5(PM 2.5 )のCCME基準は、 28 μg/m 3(1日24時間平均濃度の年間98パーセンタイルの3年間平均を使用して計算)および10 μg/m 3(年間平均値の3年間平均)です。PM 2.5基準は、2020年に厳格化されます。[266]
欧州連合
欧州連合は、大気中の粒子状物質の制限を含む欧州排出基準を制定した。 [255]
イギリス
薪の燃焼の問題を緩和するため、2021年5月から、最も汚染度の高い燃料である伝統的な住宅用石炭(瀝青炭)と湿った木材の販売ができなくなります。2m 3未満の体積で販売される木材は、「すぐに燃やせる」と認定されている必要があります。これは、水分含有量が20%以下であることを意味します。製造された固形燃料も、硫黄と煙の排出制限を満たすことを保証するために、「すぐに燃やせる」と認定されている必要があります。[267] 2022年1月から、すべての新しい薪ストーブは新しいエコデザイン基準を満たす必要があります(エコデザインストーブは、ガスセントラルヒーティングよりも450倍の有毒な大気汚染物質を排出します。現在販売が禁止されている古いストーブは、3,700倍の有毒な大気汚染物質を排出します)。[268]
2023年には、イングランドのほとんどの町や都市にある「煙制御区域」のバーナーが1時間あたりに排出できる煙の量が5グラムから3グラムに削減される。違反した場合は、その場で最高300ポンドの罰金が科せられる。従わない者は犯罪歴が残ることもある。[269]
アメリカ合衆国
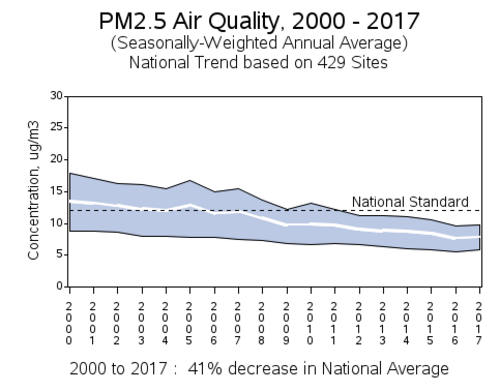
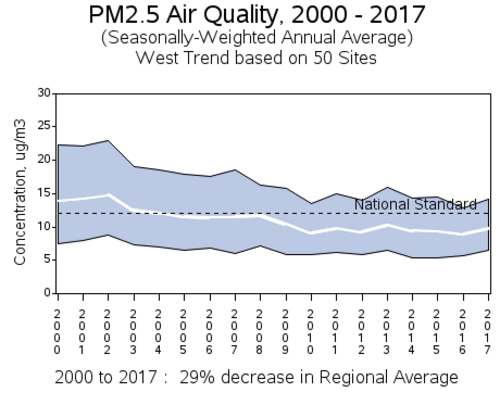
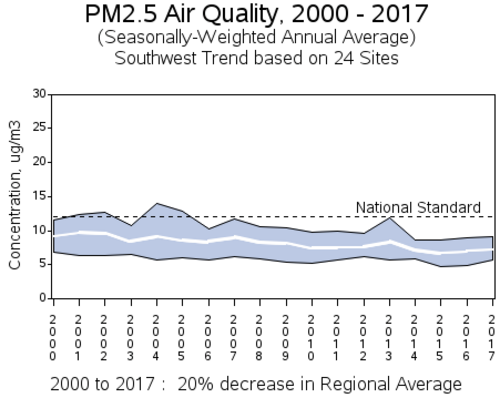
米国環境保護庁(EPA)は、 PM10とPM2.5の濃度に関する基準を設定している。[263](国家大気環境基準を参照)。
カリフォルニア
2008年10月、カリフォルニア州環境保護庁内の毒性物質管理局(DTSC)は、カーボンナノチューブの製造業者に対し、分析試験方法、環境での運命と移動、およびその他の関連情報に関する情報を要求する意向を発表した。[271] DTSCは、カリフォルニア州健康安全法第699章第57018項から第57020項に基づく権限を行使している。[272]これらの条項は、議会法案AB 289(2006年)の採択の結果として追加された。[272]これらは、化学物質の運命と移動、検出と分析、およびその他の化学物質に関する情報をより入手しやすくすることを目的としています。法律では、この情報を局に提供する責任を化学物質を製造または輸入する者に課しています。
2009年1月22日、カリフォルニア州でカーボンナノチューブを製造または輸入している、または同州にカーボンナノチューブを輸出する可能性のあるメーカーに、正式な情報要求書[273]が送付されました。 [274]この書簡は、AB 289によって制定された権限の最初の正式な実施であり、州内の産業界と学術界の両方のカーボンナノチューブメーカーと、カリフォルニア州にカーボンナノチューブを輸出しているカリフォルニア州外のメーカーに向けられています。メーカーはこの情報要求に1年以内に応えなければなりません。DTSCは、データコールインへの回答の期限である2010年1月22日を待っています。
カリフォルニアナノ産業ネットワークとDTSCは、2009年11月16日にカリフォルニア州サクラメントで終日シンポジウムを開催した。このシンポジウムでは、ナノテクノロジー業界の専門家の話を聞き、カリフォルニアにおける将来の規制上の考慮事項について議論する機会が提供された。[275]
DTSCはナノ金属酸化物の会員に特定化学物質情報の電話連絡を拡大しており、最新情報は同社のウェブサイトで確認できる。[276]
コロラド
コロラド計画の重要なポイントには、排出レベルの削減とセクター別の解決策が含まれています。農業、輸送、グリーン電力、再生可能エネルギーの研究がこの計画の主な概念と目標です。義務的な車両排出ガス検査や屋内での喫煙禁止などの政治プログラムは、きれいな空気に対する国民の意識と参加を促すために地方自治体が講じる措置です。デンバーはロッキー山脈に隣接しており、平野が広がっているため、コロラド州の州都であるこの都市圏はスモッグや目に見える大気汚染が発生しやすい場所です。[引用が必要]
影響を受ける地域

大気汚染の傾向を分析するために、世界中の480都市(ウクライナを除く)が大気の専門家によってマッピングされ[277]、 2019年の最初の9か月間のPM 2.5の平均レベルを2022年と比較して計算しました。[278] PM 2.5の平均レベルは、aqicn.orgの世界大気質指数データを使用して測定され、AirNowによって開発された式を使用して、PM 2.5の数値を立方メートルあたりの空気のマイクログラムに変換しました(μg/メートル3)値。
調査対象となった70の首都の中で、イラクのバグダッドはPM2.5レベルが+31.6上昇し 、最も悪い状況となっている。μg/メートル3モンゴルの首都ウランバートル(ウランバートル)は、PM 2.5レベルが-23.4低下し 、最も良好な状態を示しています。 μg/メートル3。以前は世界で最も汚染された首都の一つでした。2017年の大気質改善計画は良い結果を示しているようです。
480都市のうち、サウジアラビアのダンマンはPM2.5レベルが+111.1に上昇し、 最も悪い状況となっている。μg/メートル3。この都市はサウジアラビアの石油産業の重要な中心地であり、世界最大の空港とペルシャ湾最大の港がある。現在、調査対象となった都市の中で最も汚染されている。
ヨーロッパでは、最も悪い結果はスペインのサラマンカとパルマにあり、PM 2.5レベルは+5.1増加しました 。μg/メートル3および +3.7 μg/メートル3それぞれ。最も良い成績を収めたのは北マケドニアの首都スコピエで、PM 2.5レベルは-12.4低下しました 。μg/メートル3。かつてはヨーロッパで最も汚染された首都であり、きれいな空気を実現するにはまだ長い道のりが残っています。
米国では、ユタ州ソルトレイクシティとフロリダ州マイアミの2都市がPM2.5レベルの上昇率が最も高かった( +1.8 μg/メートル3)。ソルトレイクシティは「逆転現象」と呼ばれる気象現象に悩まされています。谷間に位置するため、逆転現象が発生すると、冷たく汚染された空気が上空の暖かい空気の下に地表近くに閉じ込められます。一方、ネブラスカ州オマハは最も好調で、-1.1 μg/メートル3PM2.5レベルで。
The cleanest city in this report is Zürich, Switzerland with PM2.5 levels of just 0.5 μg/m3, placed first in both 2019 and 2022. The second cleanest city is Perth, with 1.7 μg/m3 and PM2.5 levels dropping by -6.2 μg/m3 since 2019. Of the top ten cleanest cities, five are from Australia. They are Hobart, Wollongong, Launceston, Sydney and Perth. Honolulu is the only U.S. city in the top ten list, ranking tenth with levels of 4 μg/m3, with a tiny increase since 2019.
Almost all of the top ten most polluted cities are in the Middle East and Asia. The worst is Dammam in Saudi Arabia with a PM2.5 level of 155 μg/m3. Lahore in Pakistan is the second worst with 98.1 μg/m3. The third is Dubai, home to the world's tallest building. In the bottom ten are three cities from India, Muzaffarnagar, Delhi and New Delhi. Here is a list of the 30 most polluted cities by PM2.5, Jan to Sep 2022:[277]
There are limits to the above survey. For example, not every city in the world is covered, and that the number of monitoring stations for each city would not be the same. The data is for reference only.
Australia
PM10 pollution in coal mining areas in Australia such as the Latrobe Valley in Victoria and the Hunter Region in New South Wales significantly increased during 2004 to 2014. Although the increase did not significantly add to non-attainment statistics the rate of increase has risen each year during 2010 to 2014.[279]
China
Some cities in Northern China and South Asia have had concentrations above 200 μg/m3.[280] The PM levels in Chinese cities were extreme between 2010 - 2014, reaching an all-time high in Beijing on 12 January 2013, of 993 μg/m3,[69] but has been improving thanks to clean air actions.[281][282]
To monitor the air quality of south China, the U.S. Consulate Guangzhou set a PM2.5 and PM10 monitor on Shamian Island in Guangzhou and displays readings on its official website and social platforms.[283]
Europe
Italy
_pm2,5_Autumn_2019,_Winter_2019-2020,_Spring_2020_pm2,5_%E2%89%A527%C2%B5gm3_Location_45.44234_10.96862_Verona_(Borgo_Milano)_Italy.pdf/page1-1280px-VSON_WP6910_(air_detector)_pm2,5_Autumn_2019,_Winter_2019-2020,_Spring_2020_pm2,5_%E2%89%A527%C2%B5gm3_Location_45.44234_10.96862_Verona_(Borgo_Milano)_Italy.pdf.jpg)
South Korea
As of 2017, South Korea has the worst air pollution among the developed nations in the OECD (Organization for Economic Cooperation and Development).[284] According to a study conducted by NASA and NIER, 52% of PM2.5 measured in Olympic Park, Seoul in May and June 2016 came from local emissions. The rest was trans-boundary pollution coming from China's Shandong Province (22%), North Korea (9%), Beijing (7%), [[Shanghai (5%), and a combined 5% from China's Liaoning Province, Japan and the West Sea.[285] In December 2017, the environmental ministers from South Korea and China signed the China-Korea Environmental Cooperation Plan (2018–22), a five-year plan to jointly solve issues in the air, water, soil and waste. An environmental cooperation centre was also launched in 2018 to aid cooperation.[286]
Thailand
Air quality of Thailand is getting worse in 2023, which is described as a "post-COVID back-to-normal situation". In addition to the capital Bangkok, air quality in Chiang Mai, a popular tourist destination, is also deteriorating. Chiang Mai was listed as the most polluted city in a live ranking by a Swiss air quality company on 27 March 2023. The ranking includes data from about 100 world cities for which measured PM2.5 data is available.[287][288]
Ulaanbaatar
Mongolia's capital city Ulaanbaatar has an annual average mean temperature of about 0 °C, making it the world's coldest capital city. About 40% of the population lives in apartments, 80% of which are supplied with central heating systems from three combined heat and power plants. In 2007, the power plants consumed almost 3.4 million tons of coal. The pollution control technology is in poor condition. [citation needed]
The other 60% of the population reside in shantytowns (Ger districts), which have developed due to the country's new market economy and the very cold winter seasons. The poor in these districts cook and heat their wood houses with indoor stoves fueled by wood or coal. The resulting air pollution is characterized by raised sulfur dioxide and nitrogen oxide levels and very high concentrations of airborne particles and particulate matter (PM).[69] Annual seasonal average particulate matter concentrations have been recorded as high as 279 μg/m3 (micrograms per cubic meter).[citation needed] The World Health Organization's recommended annual mean PM10 level is 20 μg/m3,[289] which means that Ulaanbaatar's PM10 annual mean levels are 14 times higher than recommended.[citation needed]
During the winter months, in particular, the air pollution obscures the air, affecting the visibility in the city to such an extent that airplanes on some occasions are prevented from landing at the airport.[290]
In addition to stack emissions, another source unaccounted for in the emission inventory is fly ash from ash ponds, the final disposal place for fly ash that has been collected in settling tanks. Ash ponds are continually eroded by wind during the winter.[291]
United States
-
 U.S. counties violating national PM2.5 standards, June 2018
 -
 U.S. counties violating national PM10 standards, June 2018
From the "State of Air 2022" report compiled by the American Lung Association using data from the U.S. Environmental Protection Agency from 2018 to 2020,[292] California cities are the most polluted cities (by PM2.5) in the U.S. while the East Coast is cleaner.
However, another study has come up with a very different conclusion. According to Forbes, a travel insurance comparison site InsureMyTrip conducted a survey of 50 U.S. cities in 2020 and ranked them by cleanliness with criteria like hand sanitizer demand, cleanliness of restaurants, quantity of recycling collectors, satisfaction of garbage disposal, electric vehicle market share and pollution.[293] On their top ten cleanest cities list, seven are from California, including Long Beach (No. 1), San Diego (No. 2), Sacramento (No. 3), San Jose (No. 6), Oakland (No. 7), Bakersfield (No. 9), and San Francisco (No. 10). The discrepancies maybe due to the differences in data choice, calculation methods, definitions of "cleanliness" and a large variation of air quality across the same state, etc. This again shows that one need to be very careful when drawing conclusions from the many air quality rankings available on the internet.
In mid-2023, air quality in eastern U.S. lowered significantly as particulates from Canada's wildfires blew down. According to NASA, some of the fires were ignited by lightning.[294][12]
See also
- Air filter
- Air quality index | Air quality law
- ASTDR
- Bioaerosol
- Carbon black
- CCN (Cloud condensation nuclei)
- Chip formation
- Cleanroom
- Contamination control
- Criteria air contaminants
- Dust
- Exposure assessment | Exposure science
- Fertilizer | Pesticides
- Fog | Pea soup fog
- Fugitive dust
- Heavy industry
- List of least polluted cities by particulate matter concentration
- List of most polluted cities by particulate matter concentration
- Metal swarf | Sawdust
- NIEHS
- Non-exhaust emissions
- Occupational dust exposure
- Respirator
- Recycling
- Scrubber
- Suspended solids
Health effects:
- Health effects of coal ash
- Health effects of pesticides
- Health impact of asbestos
- Health impacts of sawdust
Health-related:
Other names
- atmospheric aerosol particles
- particulate matter (PM)
- suspended particulate matter (SPM)
Notes
- ^ PM10 limit since 1 January 2005
- ^ PM2.5 limit since 1 January 2015
- ^ Since 1 January 2014
- ^ PM10 referred to as Suspended Particulate Matter
- ^ PM2.5 limit since 21 September 2009
- ^ PM10 limit since 4 December 2006
- ^ PM2.5 limit since 27 March 2018
- ^ annual limit since 2024
- ^ daily limit since 2007
- ^ annual limit removed in 2006
- ^ daily limit since 1987[264]
- ^ 3-year average of annual 98th percentile
References
- ^ Seinfeld J, Pandis S (1998). Atmospheric Chemistry and Physics: From Air Pollution to Climate Change (2nd ed.). Hoboken, New Jersey: John Wiley & Sons. p. 97. ISBN 978-0-471-17816-3.
- ^ Plainiotis S, Pericleous KA, Fisher BE, Shier L (January 2010). "Application of Lagrangian particle dispersion models to air quality assessment in the Trans-Manche region of Nord-Pas-de-Calais (France) and Kent (Great Britain)" (PDF). International Journal of Environment and Pollution. 40 (1/2/3): 160–74. doi:10.1504/IJEP.2010.030891.
- ^ Brown JS, Gordon T, Price O, Asgharian B (April 2013). "Thoracic and respirable particle definitions for human health risk assessment". Particle and Fibre Toxicology. 10 (1): 12. Bibcode:2013PFTox..10...12B. doi:10.1186/1743-8977-10-12. PMC 3640939. PMID 23575443.
- ^ a b US EPA, OAR (19 April 2016). "Particulate Matter (PM) Basics". US EPA. Retrieved 5 October 2019.
- ^ "EHP – Outdoor Particulate Matter Exposure and Lung Cancer: A Systematic Review and Meta-Analysis". ehp.niehs.nih.gov. Archived from the original on 29 May 2016. Retrieved 29 December 2016.
- ^ Wasley, Andrew; Heal, Alexandra; Harvey, Fiona; Lainio, Mie (13 June 2019). "Revealed: UK government failing to tackle rise of serious air pollutant". The Guardian.
- ^ Thangavel, Prakash; Park, Duckshin; Lee, Young-Chul (19 June 2022). "Recent Insights into Particulate Matter (PM2.5)-Mediated Toxicity in Humans: An Overview". International Journal of Environmental Research and Public Health. 19 (12): 7511. doi:10.3390/ijerph19127511. ISSN 1660-4601. PMC 9223652. PMID 35742761.
- ^ "STATE OF GLOBAL AIR/2018 A SPECIAL REPORT ON GLOBAL EXPOSURE TO AIR POLLUTION AND ITS DISEASE BURDEN" (PDF). Health Effects Institute. 2018.
- ^ "The Weight of Numbers: Air Pollution and PM2.5". Undark. Retrieved 6 September 2018.
- ^ Omidvarborna; et al. (2015). "Recent studies on soot modeling for diesel combustion". Renewable and Sustainable Energy Reviews. 48: 635–647. Bibcode:2015RSERv..48..635O. doi:10.1016/j.rser.2015.04.019.
- ^ "Air quality, EASA Eco".
- ^ a b Lee, Giyoon; Ahn, Jinho; Park, Seung-Myung; Moon, Jonghan; Park, Rokjin; Sim, Min Sub; Choi, Hanna; Park, Jinsoo; Ahn, Joon-Young (17 September 2023). "Sulfur isotope-based source apportionment and control mechanisms of PM2.5 sulfate in Seoul, South Korea during winter and early spring (2017–2020)". Science of the Total Environment. 905. doi:10.1016/j.scitotenv.2023.167112. PMID 37717778. S2CID 262046328.
- ^ Lin C, Huang RJ, Duan J, Zhong H, Xu W, Wu Y, Zhang R (April 2022). "Large contribution from worship activities to the atmospheric soot particles in northwest China". Environ Pollut. 299: 118907. Bibcode:2022EPoll.29918907L. doi:10.1016/j.envpol.2022.118907. PMID 35091017. S2CID 246355499.
- ^ Giang, Lam Van; Thanh, Tran; Hien, Truong Thanh; Tan, Lam Van; Thi Bich Phuong, Tran; Huu Loc, Ho (2021). "Heavy metals emissions from joss paper burning rituals and the air quality around a specific incinerator". Materials Today: Proceedings. 38: 2751–2757. doi:10.1016/j.matpr.2020.08.686. S2CID 226353498.
- ^ Shen H, Tsai CM, Yuan CS, Jen YH, Ie IR (January 2017). "How incense and joss paper burning during the worship activities influences ambient mercury concentrations in indoor and outdoor environments of an Asian temple?". Chemosphere. 167: 530–540. Bibcode:2017Chmsp.167..530S. doi:10.1016/j.chemosphere.2016.09.159. PMID 27764746.
- ^ Ramadan, Bimastyaji Surya; Rosmalina, Raden Tina; Syafrudin; Munawir; Khair, Hafizhul; Rachman, Indriyani; Matsumoto, Toru (2023). "Potential Risks of Open Waste Burning at the Household Level: A Case Study of Semarang, Indonesia". Aerosol and Air Quality Research. 23 (5). Taiwan Association for Aerosol Research: 220412. doi:10.4209/aaqr.220412. ISSN 1680-8584. S2CID 257202752.
- ^ Shah R, Limaye S, Ujagare D, Madas S, Salvi S (2019). "Personal exposures to particulate matter <2.5 μm in mass median aerodynamic diameter (PM2.5) pollution during the burning of six most commonly used firecrackers in India". Lung India. 36 (4): 324–329. doi:10.4103/lungindia.lungindia_440_18. PMC 6625239. PMID 31290418.
- ^ Roy, Rajarshi; Schooff, Brian; Li, Xiaolong; Montgomery, Scott; Tuttle, Jacob; Wendt, Jost O. L.; Dickson, Kingsley; Iverson, Brian; Fry, Andrew (1 May 2023). "Ash aerosol particle size distribution, composition, and deposition behavior while co-firing coal and steam-exploded biomass in a 1.5 MWth combustor". Fuel Processing Technology. 243: 107674. doi:10.1016/j.fuproc.2023.107674. S2CID 256529257.
- ^ Azarmi, Farhad; Kumar, Prashant (2016). "Ambient exposure to coarse and fine particle emissions from building demolition". Atmospheric Environment. 137: 62–79. Bibcode:2016AtmEn.137...62A. doi:10.1016/j.atmosenv.2016.04.029.
- ^ "Emissions of air pollutants in the UK – Particulate matter (PM10 and PM2.5)".
- ^ "Building works responsible for 18% of UK large particle pollution". 21 October 2022.
- ^ "Delhi's deadly dust: how construction sites are choking the city". 15 February 2017.
- ^ "Particulate matter emissions from activities of building refurbishment".
- ^ "一家三口中鉛毒 疑含鉛船用油漆髹浴室門所致 衛生署提家中裝修注意事項 (14:05)". 明報新聞網 - 即時新聞 instant news (in Traditional Chinese). June 2024.
- ^ "GovHK: Green Tips for Home Renovation". GovHK. 16 September 2024. Retrieved 22 September 2024.
- ^ "SF Concrete Plant That Was Focus of NBC Bay Area Investigative Report, Ordered to Shut Down". 11 March 2022.
- ^ Scoop, pollution at Yau Tong Cement batching plant. HK: TVB.
- ^ Orirental Daily News once again revealed that the Yau Tong Concrete Plant violated regulations and emitted a large amount of smoke and dust, up to 40 meters. HK: Oriental Daily News.
- ^ Kholodov A, Zakharenko A, Drozd V, Chernyshev V, Kirichenko K, Seryodkin I, Karabtsov A, Olesik S, Khvost E, Vakhnyuk I, Chaika V, Stratidakis A, Vinceti M, Sarigiannis D, Hayes AW, Tsatsakis A, Golokhvast K (February 2020). "Identification of cement in atmospheric particulate matter using the hybrid method of laser diffraction analysis and Raman spectroscopy". Heliyon. 6 (2): e03299. Bibcode:2020Heliy...603299K. doi:10.1016/j.heliyon.2020.e03299. PMC 7042420. PMID 32128461.
- ^ "Cut down construction dust" (PDF).
- ^ "Proper Covering of Dusty Material on Dump Trucks". www.epd.gov.hk.
- ^ "Dusty Material - an overview | ScienceDirect Topics". www.sciencedirect.com.
- ^ Kim JY, Chen JC, Boyce PD, Christiani DC (March 2005). "Exposure to welding fumes is associated with acute systemic inflammatory responses". Occup Environ Med. 62 (3): 157–63. doi:10.1136/oem.2004.014795. PMC 1740976. PMID 15723880.
- ^ Bruschweiler ED, Danuser B, Huynh CK, Wild P, Schupfer P, Vernez D, Boiteux P, Hopf NB (2012). "Generation of polycyclic aromatic hydrocarbons (PAHs) during woodworking operations". Front Oncol. 2: 148. doi:10.3389/fonc.2012.00148. PMC 3475003. PMID 23087908.
- ^ "Woodworking health topics - Inhaling wood dust".
- ^ Patel, Sameer; Sankhyan, Sumit; Boedicker, Erin K.; DeCarlo, Peter F.; Farmer, Delphine K.; Goldstein, Allen H.; Katz, Erin F.; Nazaroff, William W; Tian, Yilin; Vanhanen, Joonas; Vance, Marina E. (16 June 2020). "Indoor Particulate Matter during HOMEChem: Concentrations, Size Distributions, and Exposures". Environmental Science & Technology. 54 (12): 7107–7116. Bibcode:2020EnST...54.7107P. doi:10.1021/acs.est.0c00740. ISSN 0013-936X. PMID 32391692. Archived from the original on 28 April 2023. Retrieved 11 April 2024.
- ^ "Dust advice for businesses - EPA Victoria".
- ^ Henneman L, Choirat C, Dedoussi I, Dominici F, Roberts J, Zigler C (November 2023). "Mortality risk from United States coal electricity generation". Science. 382 (6673): 941–946. Bibcode:2023Sci...382..941H. doi:10.1126/science.adf4915. PMC 10870829. PMID 37995235.
- ^ Lin Y, Zou J, Yang W, Li CQ (March 2018). "A Review of Recent Advances in Research on PM2.5in China". Int J Environ Res Public Health. 15 (3): 438. doi:10.3390/ijerph15030438. PMC 5876983. PMID 29498704.
- ^ Sharma R, Sharma M, Sharma R, Sharma V (2013). "The impact of incinerators on human health and environment". Rev Environ Health. 28 (1): 67–72. doi:10.1515/reveh-2012-0035. PMID 23612530. S2CID 21271240.
- ^ Non-exhaust Particulate Emissions from Road Transport. OECD. 2020. doi:10.1787/4a4dc6ca-en. ISBN 978-92-64-88885-2. S2CID 136987659.
- ^ Khan RK, Strand MA (2018). "Road dust and its effect on human health: a literature review". Epidemiol Health. 40: e2018013. doi:10.4178/epih.e2018013. PMC 5968206. PMID 29642653.
- ^ Fan, Long; Liu, Shimin (2021). "Respirable nano-particulate generations and their pathogenesis in mining workplaces: a review". International Journal of Coal Science & Technology. 8 (2): 179–198. Bibcode:2021IJCST...8..179F. doi:10.1007/s40789-021-00412-w. S2CID 233890096.
- ^ Petavratzi, E.; Kingman, S.; Lowndes, I. (2005). "Particulates from mining operations: A review of sources, effects and regulations". Minerals Engineering. 18 (12): 1183–1199. Bibcode:2005MiEng..18.1183P. doi:10.1016/j.mineng.2005.06.017.
- ^ Jeong H, Choi JY, Ra K (March 2021). "Potentially toxic elements pollution in road deposited sediments around the active smelting industry of Korea". Sci Rep. 11 (1): 7238. doi:10.1038/s41598-021-86698-x. PMC 8012626. PMID 33790361.
- ^ McLaughlin, Tim (6 January 2022). "Harmful soot unchecked as Big Oil battles EPA over testing". Reuters.
- ^ Chandrappa, R.; Chandra Kulshrestha, U. (2016). "Air Pollution and Disasters". Sustainable Air Pollution Management. Environmental Science and Engineering. pp. 325–343. doi:10.1007/978-3-319-21596-9_8. ISBN 978-3-319-21595-2. PMC 7121041.
- ^ "Sand, Dust and Particulates Public Health".
- ^ Zalakeviciute, Rasa; Mejia, Danilo; Alvarez, Hermel; Bermeo, Xavier; Bonilla-Bedoya, Santiago; Rybarczyk, Yves; Lamb, Brian (2022). "WarImpact on Air Quality in Ukraine". Sustainability. 14 (21): 13832. doi:10.3390/su142113832.
- ^ Xie Y, Li Y, Feng Y, Cheng W, Wang Y (April 2022). "Inhalable microplastics prevails in air: Exploring the size detection limit". Environ Int. 162: 107151. Bibcode:2022EnInt.16207151X. doi:10.1016/j.envint.2022.107151. PMID 35228011.
- ^ Liu C, Li J, Zhang Y, Wang L, Deng J, Gao Y, Yu L, Zhang J, Sun H (July 2019). "Widespread distribution of PET and PC microplastics in dust in urban China and their estimated human exposure". Environ Int. 128: 116–124. Bibcode:2019EnInt.128..116L. doi:10.1016/j.envint.2019.04.024. PMID 31039519.
- ^ a b Hardin M, Kahn R (2 November 2010). "Aerosols and Climate Change".
- ^ "Emissions of air pollutants". 22 February 2023.
- ^ Hawkes N (May 2015). "Air pollution in UK: the public health problem that won't go away". BMJ. 350: h2757. doi:10.1136/bmj.h2757. PMID 26001592. S2CID 40717317.
- ^ Carrington, Damian (16 February 2021). "Wood burning at home now biggest cause of UK particle pollution". The Guardian. Retrieved 13 February 2022.
- ^ "Wood burning heaters and your health - Fact sheets".
- ^ "How to choose and maintain a wood heater - EPA Victoria".
- ^ "How to choose the right wood for your wood heater - EPA Victoria".
- ^ "How to light and maintain your wood heater fire - EPA Victoria".
- ^ "Smoke and the law - EPA Victoria".
- ^ "Simulating the Transport of Aerosols with GEOS-5, GMAO".
- ^ "GMAO - Global Modeling and Assimilation Office Research Site". gmao.gsfc.nasa.gov.
- ^ "Primary and Secondary Sources of Aerosols: Soil dust". Climate Change 2001: Working Group 1. UNEP. 2001. Archived from the original on 28 February 2008. Retrieved 6 February 2008.
- ^ Perraud V, Bruns EA, Ezell MJ, Johnson SN, Yu Y, Alexander ML, et al. (February 2012). "Nonequilibrium atmospheric secondary organic aerosol formation and growth". Proceedings of the National Academy of Sciences of the United States of America. 109 (8): 2836–41. Bibcode:2012PNAS..109.2836P. doi:10.1073/pnas.1119909109. PMC 3286997. PMID 22308444.
- ^ "Primary and Secondary Sources of Aerosols: Sea salt". Climate Change 2001: Working Group 1. UNEP. 2001. Archived from the original on 28 February 2008. Retrieved 6 February 2008.
- ^ Schiffer, J. M.; Mael, L. E.; Prather, K. A.; Amaro, R. E.; Grassian, V. H. (2018). "Sea Spray Aerosol: Where Marine Biology Meets Atmospheric Chemistry". ACS Central Science. 4 (12): 1617–1623. doi:10.1021/acscentsci.8b00674. PMC 6311946. PMID 30648145.
- ^ "Primary and Secondary Sources of Aerosols: Primary biogenic aerosols". Climate Change 2001: Working Group 1. UNEP. 2001. Archived from the original on 28 February 2008. Retrieved 6 February 2008.
- ^ Barringer, Felicity (18 February 2012). "Scientists Find New Dangers in Tiny but Pervasive Particles in Air Pollution". The New York Times. Retrieved 19 February 2012.
- ^ a b c d "Mongolia: Air Pollution in Ulaanbaatar – Initial Assessment of Current Situations and Effects of Abatement Measures" (PDF). The World Bank. 2010. Archived from the original (PDF) on 19 September 2016.
- ^ a b "Aerosol Size, Earth Observatory". NASA. 31 August 2016.
 This article incorporates text from this source, which is in the public domain.
- ^ "An American Aerosol in Paris". 15 September 2017.
- ^ Goswami A, Barman J, Rajput K, Lakhlani HN (2013). "Behaviour Study of Particulate Matter and Chemical Composition with Different Combustion Strategies". SAE Technical Paper Series. Vol. 1. doi:10.4271/2013-01-2741. Retrieved 17 June 2016.
- ^ "Effect Of Particulate Matter On Plants Climate, Ecosystem and Human Health" (PDF). www.ijates.com. April 2014. Retrieved 3 February 2016.
- ^ "What are PM2.5 filters and why are they effective?". Puraka Masks.
- ^ Chen, J.; Jiang, Z. A.; Chen, J. (2018). "Effect of Inlet Air Volumetric Flow Rate on the Performance of a Two-Stage Cyclone Separator". ACS Omega. 3 (10): 13219–13226. doi:10.1021/acsomega.8b02043. PMC 6644756. PMID 31458040.
- ^ Dominick DalSanto (February 2011). "The Encyclopedia of Dust Collection".
- ^ "Integrated Building Rehabilitation Assistance Scheme".
- ^ "Operation Building Bright 2.0".
- ^ "DEVB - Press Releases: Operation Building Bright launched (with photos, 2009)".
- ^ "Hong Kong watchdog arrests 49 suspects in housing renovation scam involving contracts worth HK$500 million". 6 January 2023.
- ^ "大廈外牆維修,你地會搬走嗎?" [Will you move out because there is building exterior wall repair work?] (in Chinese).
- ^ "買樓難題:大廈維修,住得難頂嗎?" [The problem of buying a house: Is it difficult to live in a building under rehabilitation?] (in Chinese).
- ^ "Operation Building Bright improves living environment of residents (with photos/video)".
- ^ a b "Hong Kong eLegislation, AIR POLLUTION CONTROL (CONSTRUCTION DUST) REGULATION (Cap.311 section 43) 16 June 1997, L.N. 304 of 1997".
- ^ "Monitoring by Control Technique - Wet Scrubber For Particulate Matter". 25 May 2016.
- ^ "Monitoring by Control Technique - Electrostatic Precipitators". 24 May 2016.
- ^ "Enforcement Activities and Statistics under the Air Pollution Control Ordinance and the Ozone Layer Protection Ordinance 2021".
- ^ "Construction contractor fined for carrying out building demolition work in Shek O without appropriate dust control measures".
- ^ "Pollution Problems & Practical Solutions".
- ^ "Delhi Govt To Impose Fines On Violation Of Anti-Dust Norms". 6 October 2022.
- ^ "Management Regulations for Construction Project Air Pollution Control Facilities".
- ^ "Revised GRAP to deal with adverse air quality scenario".
- ^ "Achievements in environmental pollution control on construction activities, 2004".
- ^ "Particulate Matter in the United Kingdom Summary" (PDF). Air Quality Expert Group. Defra. 2005. Retrieved 28 June 2023.
- ^ "Condensation particle counters". Center for Atmospheric Science. University of Manchester. Retrieved 5 July 2023.
- ^ Department for Environment, Food and Rural Affairs (Defra) webmaster@defra gsi gov uk. "Particle Numbers and Concentrations Network- Defra, UK". uk-air.defra.gov.uk.
- ^ Gilfrich, J; Burkhalter, P; Birks, L (1973). "X-ray spectrometry for particulate air pollution—a quantitative comparison of techniques". Anal Chem. 45 (12): 2002–9. doi:10.1021/ac60334a033. PMID 4762375.
- ^ Forster, Piers M.; Smith, Christopher J.; Walsh, Tristram; Lamb, William F.; et al. (2023). "Indicators of Global Climate Change 2022: annual update of large-scale indicators of the state of the climate system and human influence" (PDF). Earth System Science Data. 15 (6). Copernicus Programme: 2295–2327. Bibcode:2023ESSD...15.2295F. doi:10.5194/essd-15-2295-2023. Fig. 2(a).
- ^ a b Haywood, James; Boucher, Olivier (November 2000). "Estimates of the direct and indirect radiative forcing due to tropospheric aerosols: A review". Reviews of Geophysics. 38 (4): 513–543. Bibcode:2000RvGeo..38..513H. doi:10.1029/1999RG000078. S2CID 129107853.
- ^ a b Twomey S (1977). "The influence of pollution on the shortwave albedo of clouds". Journal of the Atmospheric Sciences. 34 (7): 1149–1152. Bibcode:1977JAtS...34.1149T. doi:10.1175/1520-0469(1977)034<1149:TIOPOT>2.0.CO;2.
- ^ a b c d e f Forster P, Ramaswamy V, Artaxo P, Berntsen T, Betts R, Fahey DW, Haywood J, et al. (October 2007). "Contribution of Working Group I to the Fourth Assessment Report of the Intergovernmental Panel on Climate Change in Climate Change 2007: The Physical Science Basis". In Solomon S, Qin D, Manning M, Chen Z, Marquis M, Averyt KB, Tignor M, Miller HL (eds.). Changes in Atmospheric Constituents and in Radiative Forcing. Cambridge, United Kingdom and New York, NY, US: Cambridge University Press. pp. 129–234.
- ^ "6.7.8 Discussion of Uncertainties". IPCC Third Assessment Report – Climate Change 2001. Archived from the original on 28 February 2002. Retrieved 14 July 2012.
- ^ Charlson RJ, Schwartz SE, Hales JM, Cess RD, Coakley JA, Hansen JE, Hofmann DJ (January 1992). "Climate forcing by anthropogenic aerosols". Science. 255 (5043): 423–30. Bibcode:1992Sci...255..423C. doi:10.1126/science.255.5043.423. PMID 17842894. S2CID 26740611.
- ^ Ackerman AS, Toon OB, Taylor JP, Johnson DW, Hobbs PV, Ferek RJ (2000). "Effects of Aerosols on Cloud Albedo: Evaluation of Twomey's Parameterization of Cloud Susceptibility Using Measurements of Ship Tracks". Journal of the Atmospheric Sciences. 57 (16): 2684–2695. Bibcode:2000JAtS...57.2684A. doi:10.1175/1520-0469(2000)057<2684:EOAOCA>2.0.CO;2.
- ^ Kaufman YJ, Fraser RS (1997). "The Effect of Smoke Particles on Clouds and Climate Forcing". Science. 277 (5332): 1636–1639. doi:10.1126/science.277.5332.1636.
- ^ Ferek RJ, Garrett T, Hobbs PV, Strader S, Johnson D, Taylor JP, Nielsen K, Ackerman AS, Kogan Y, Liu Q, Albrecht BA, et al. (2000). "Drizzle Suppression in Ship Tracks". Journal of the Atmospheric Sciences. 57 (16): 2707–2728. Bibcode:2000JAtS...57.2707F. doi:10.1175/1520-0469(2000)057<2707:DSIST>2.0.CO;2. hdl:10945/46780. S2CID 40273867.
- ^ Rosenfeld D (1999). "TRMM observed first direct evidence of smoke from forest fires inhibiting rainfall". Geophysical Research Letters. 26 (20): 3105–3108. Bibcode:1999GeoRL..26.3105R. doi:10.1029/1999GL006066.
- ^ a b Hansen J, Sato M, Ruedy R (1997). "Radiative forcing and climate response". Journal of Geophysical Research. 102 (D6): 6831–6864. Bibcode:1997JGR...102.6831H. doi:10.1029/96JD03436.
- ^ Ackerman AS, Toon OB, Stevens DE, Heymsfield AJ, Ramanathan V, Welton EJ (May 2000). "Reduction of tropical cloudiness by soot". Science. 288 (5468): 1042–7. Bibcode:2000Sci...288.1042A. doi:10.1126/science.288.5468.1042. PMID 10807573.
- ^ Koren I, Kaufman YJ, Remer LA, Martins JV (February 2004). "Measurement of the effect of Amazon smoke on inhibition of cloud formation". Science. 303 (5662): 1342–5. Bibcode:2004Sci...303.1342K. doi:10.1126/science.1089424. PMID 14988557. S2CID 37347993.
- ^ Riva, Matthieu; Chen, Yuzhi; Zhang, Yue; Lei, Ziying; Olson, Nicole E.; Boyer, Hallie C.; Narayan, Shweta; Yee, Lindsay D.; Green, Hilary S.; Cui, Tianqu; Zhang, Zhenfa; Baumann, Karsten; Fort, Mike; Edgerton, Eric; Budisulistiorini, Sri H. (6 August 2019). "Increasing Isoprene Epoxydiol-to-Inorganic Sulfate Aerosol Ratio Results in Extensive Conversion of Inorganic Sulfate to Organosulfur Forms: Implications for Aerosol Physicochemical Properties". Environmental Science & Technology. 53 (15): 8682–8694. Bibcode:2019EnST...53.8682R. doi:10.1021/acs.est.9b01019. ISSN 0013-936X. PMC 6823602. PMID 31335134.
- ^ Seinfeld, John H.; Pandis, Spyros N (1998). Atmospheric Chemistry and Physics — From Air Pollution to Climate Change. John Wiley and Sons, Inc. ISBN 978-0-471-17816-3
- ^ a b Legras, Bernard; Duchamp, Clair; Sellitto, Pasquale; Podglajen, Aurélien; Carboni, Elisa; Siddans, Richard; Grooß, Jens-Uwe; Khaykin, Sergey; Ploeger, Felix (23 November 2022). "The evolution and dynamics of the Hunga Tonga plume in the stratosphere". Atmospheric Chemistry and Physics. 22 (22): 14957–14970. doi:10.5194/acp-22-14957-2022. S2CID 253875202.
- ^ Charlson, Robert J.; Wigley, Tom M. L. (1994). "Sulfate Aerosol and Climatic Change". Scientific American. 270 (2): 48–57. Bibcode:1994SciAm.270b..48C. doi:10.1038/scientificamerican0294-48. ISSN 0036-8733. JSTOR 24942590.
- ^ Allen, Bob (6 April 2015). "Atmospheric Aerosols: What Are They, and Why Are They So Important?". NASA. Retrieved 17 April 2023.
- ^ IPCC, 1990: Chapter 1: Greenhouse Gases and Aerosols [R.T. Watson, H. Rodhe, H. Oeschger and U. Siegenthaler]. In: Climate Change: The IPCC Scientific Assessment [J.T.Houghton, G.J.Jenkins and J.J.Ephraums (eds.)]. Cambridge University Press, Cambridge, United Kingdom and New York, NY, USA, pp. 31–34,
- ^ a b c Effects of Acid Rain – Human Health Archived January 18, 2008, at the Wayback Machine. Epa.gov (June 2, 2006). Retrieved on 2013-02-09.
- ^ "Effects of Acid Rain - Surface Waters and Aquatic Animals". US EPA. Archived from the original on 14 May 2009.
- ^ Likens, G. E.; Driscoll, C. T.; Buso, D. C. (1996). "Long-Term Effects of Acid Rain: Response and Recovery of a Forest Ecosystem" (PDF). Science. 272 (5259): 244. Bibcode:1996Sci...272..244L. doi:10.1126/science.272.5259.244. S2CID 178546205. Archived (PDF) from the original on 24 December 2012. Retrieved 9 February 2013.
- ^ Wang, X.; Ding, H.; Ryan, L.; Xu, X. (1 May 1997). "Association between air pollution and low birth weight: a community-based study". Environmental Health Perspectives. 105 (5): 514–20. doi:10.1289/ehp.97105514. ISSN 0091-6765. PMC 1469882. PMID 9222137. S2CID 2707126.
- ^ Tie, X.; et al. (2003). "Effect of sulfate aerosol on tropospheric NOx and ozone budgets: Model simulations and TOPSE evidence". J. Geophys. Res. 108 (D4): 8364. Bibcode:2003JGRD..108.8364T. doi:10.1029/2001JD001508.
- ^ Clean Air Act Reduces Acid Rain In Eastern United States Archived August 8, 2018, at the Wayback Machine, ScienceDaily, September 28, 1998
- ^ "Air Emissions Trends – Continued Progress Through 2005". U.S. Environmental Protection Agency. 8 July 2014. Archived from the original on 17 March 2007. Retrieved 17 March 2007.
- ^ Moses, Elizabeth; Cardenas, Beatriz; Seddon, Jessica (25 February 2020). "The Most Successful Air Pollution Treaty You've Never Heard Of".
- ^ Stanhill, G.; S. Cohen (2001). "Global dimming: a review of the evidence for a widespread and significant reduction in global radiation with discussion of its probable causes and possible agricultural consequences". Agricultural and Forest Meteorology. 107 (4): 255–278. Bibcode:2001AgFM..107..255S. doi:10.1016/S0168-1923(00)00241-0.
- ^ Cohen, Shabtai; Stanhill, Gerald (1 January 2021), Letcher, Trevor M. (ed.), "Chapter 32 – Changes in the Sun's radiation: the role of widespread surface solar radiation trends in climate change: dimming and brightening", Climate Change (Third Edition), Elsevier, pp. 687–709, doi:10.1016/b978-0-12-821575-3.00032-3, ISBN 978-0-12-821575-3, S2CID 234180702, retrieved 26 April 2023
- ^ "Global 'Sunscreen' Has Likely Thinned, Report NASA Scientists". NASA. 15 March 2007. Archived from the original on 22 December 2018. Retrieved 28 June 2023.
- ^ "A bright sun today? It's down to the atmosphere". The Guardian. 2017. Archived from the original on 20 May 2017. Retrieved 19 May 2017.
- ^ Seneviratne, S.I.; Zhang, X.; Adnan, M.; Badi, W.; Dereczynski, C.; Di Luca, A.; Ghosh, S.; Iskandar, I.; Kossin, J.; Lewis, S.; Otto, F.; Pinto, I.; Satoh, M.; Vicente-Serrano, S. M.; Wehner, M.; Zhou, B. (2021). Masson-Delmotte, V.; Zhai, P.; Piran, A.; Connors, S.L.; Péan, C.; Berger, S.; Caud, N.; Chen, Y.; Goldfarb, L. (eds.). "Weather and Climate Extreme Events in a Changing Climate" (PDF). Climate Change 2021: The Physical Science Basis. Contribution of Working Group I to the Sixth Assessment Report of the Intergovernmental Panel on Climate Change. 2021: 1238. Bibcode:2021AGUFM.U13B..05K. doi:10.1017/9781009157896.007.
- ^ Gillett, Nathan P.; Kirchmeier-Young, Megan; Ribes, Aurélien; Shiogama, Hideo; Hegerl, Gabriele C.; Knutti, Reto; Gastineau, Guillaume; John, Jasmin G.; Li, Lijuan; Nazarenko, Larissa; Rosenbloom, Nan; Seland, Øyvind; Wu, Tongwen; Yukimoto, Seiji; Ziehn, Tilo (18 January 2021). "Constraining human contributions to observed warming since the pre-industrial period" (PDF). Nature Climate Change. 11 (3): 207–212. Bibcode:2021NatCC..11..207G. doi:10.1038/s41558-020-00965-9. S2CID 231670652.
- ^ IPCC, 2021: Summary for Policymakers. In: Climate Change 2021: The Physical Science Basis. Contribution of Working Group I to the Sixth Assessment Report of the Intergovernmental Panel on Climate Change [Masson-Delmotte, V., P. Zhai, A. Pirani, S.L. Connors, C. Péan, S. Berger, N. Caud, Y. Chen, L. Goldfarb, M.I. Gomis, M. Huang, K. Leitzell, E. Lonnoy, J.B.R. Matthews, T.K. Maycock, T. Waterfield, O. Yelekçi, R. Yu, and B. Zhou (eds.)]. Cambridge University Press, Cambridge, United Kingdom and New York, NY, USA, pp. 3–32, doi:10.1017/9781009157896.001.
- ^ Andrew, Tawana (27 September 2019). "Behind the Forecast: How clouds affect temperatures". Science Behind the Forecast. LOUISVILLE, Ky. (WAVE). Retrieved 4 January 2023.
- ^ McCoy, Daniel T.; Field, Paul; Gordon, Hamish; Elsaesser, Gregory S.; Grosvenor, Daniel P. (6 April 2020). "Untangling causality in midlatitude aerosol–cloud adjustments". Atmospheric Chemistry and Physics. 20 (7): 4085–4103. Bibcode:2020ACP....20.4085M. doi:10.5194/acp-20-4085-2020.
- ^ Rosenfeld, Daniel; Zhu, Yannian; Wang, Minghuai; Zheng, Youtong; Goren, Tom; Yu, Shaocai (2019). "Aerosol-driven droplet concentrations dominate coverage and water of oceanic low level clouds" (PDF). Science. 363 (6427): eaav0566. doi:10.1126/science.aav0566. PMID 30655446. S2CID 58612273.
- ^ Glassmeier, Franziska; Hoffmann, Fabian; Johnson, Jill S.; Yamaguchi, Takanobu; Carslaw, Ken S.; Feingold, Graham (29 January 2021). "Aerosol-cloud-climate cooling overestimated by ship-track data". Science. 371 (6528): 485–489. Bibcode:2021Sci...371..485G. doi:10.1126/science.abd3980. PMID 33510021.
- ^ Manshausen, Peter; Watson-Parris, Duncan; Christensen, Matthew W.; Jalkanen, Jukka-Pekka; Stier, Philip Stier (7 March 2018). "Invisible ship tracks show large cloud sensitivity to aerosol". Nature. 610 (7930): 101–106. doi:10.1038/s41586-022-05122-0. PMC 9534750. PMID 36198778.
- ^ Jongebloed, U. A.; Schauer, A. J.; Cole-Dai, J.; Larrick, C. G.; Wood, R.; Fischer, T. P.; Carn, S. A.; Salimi, S.; Edouard, S. R.; Zhai, S.; Geng, L.; Alexander, B. (2 January 2023). "Underestimated Passive Volcanic Sulfur Degassing Implies Overestimated Anthropogenic Aerosol Forcing". Geophysical Research Letters. 50 (1): e2022GL102061. Bibcode:2023GeoRL..5002061J. doi:10.1029/2022GL102061. S2CID 255571342.
- ^ Visioni, Daniele; Slessarev, Eric; MacMartin, Douglas G; Mahowald, Natalie M; Goodale, Christine L; Xia, Lili (1 September 2020). "What goes up must come down: impacts of deposition in a sulfate geoengineering scenario". Environmental Research Letters. 15 (9): 094063. Bibcode:2020ERL....15i4063V. doi:10.1088/1748-9326/ab94eb. ISSN 1748-9326.
- ^ Andrew Charlton-Perez & Eleanor Highwood. "Costs and benefits of geo-engineering in the Stratosphere" (PDF). Archived from the original (PDF) on 14 January 2017. Retrieved 17 February 2009.
- ^ Trisos, Christopher H.; Geden, Oliver; Seneviratne, Sonia I.; Sugiyama, Masahiro; van Aalst, Maarten; Bala, Govindasamy; Mach, Katharine J.; Ginzburg, Veronika; de Coninck, Heleen; Patt, Anthony (2021). "Cross-Working Group Box SRM: Solar Radiation Modification" (PDF). Climate Change 2021: The Physical Science Basis. Contribution of Working Group I to the Sixth Assessment Report of the Intergovernmental Panel on Climate Change. 2021: 1238. Bibcode:2021AGUFM.U13B..05K. doi:10.1017/9781009157896.007.
- ^ Bond, T. C. (2013). "Bounding the role of black carbon in the climate system: A scientific assessment". Journal of Geophysical Research: Atmospheres. 118 (11): 5380–5552. Bibcode:2013JGRD..118.5380B. doi:10.1002/jgrd.50171.
- ^ "1600 Eruption Caused Global Disruption" Archived 15 February 2011 at the Wayback Machine, Geology Times, 25 April 2008, accessed 13 November 2010
- ^ Andrea Thompson, "Volcano in 1600 caused global disruption", NBC News, 5 May 2008, accessed 13 November 2010
- ^ "The 1600 eruption of Huaynaputina in Peru caused global disruption" Archived 28 April 2010 at the Wayback Machine, Science Centric
- ^ McCormick, M. Patrick; Thomason, Larry W.; Trepte, Charles R. (February 1995). "Atmospheric effects of the Mt Pinatubo eruption". Nature. 373 (6513): 399–404. Bibcode:1995Natur.373..399M. doi:10.1038/373399a0. S2CID 46437912.
- ^ Stowe LL, Carey RM, Pellegrino PP (1992). "Monitoring the Mt. Pinatubo aerosol layer with NOAA/11 AVHRR data". Geophysical Research Letters (Submitted manuscript). 19 (2): 159–162. Bibcode:1992GeoRL..19..159S. doi:10.1029/91GL02958.
- ^ Perkins, Sid (4 March 2013). "Earth Not So Hot Thanks to Volcanoes". Science. doi:10.1126/article.26322 (inactive 2 September 2024).
{{cite journal}}: CS1 maint: DOI inactive as of September 2024 (link) - ^ Neely III RR, Toon OB, Solomon S, Vernier JP, Alvarez C, English JM, Rosenlof KH, Mills MJ, Bardeen CG, Daniel JS, Thayer JP (2013). "Recent anthropogenic increases in SO2 from Asia have minimal impact on stratospheric aerosol". Geophysical Research Letters. 40 (5): 999–1004. Bibcode:2013GeoRL..40..999N. doi:10.1002/grl.50263. hdl:1721.1/85851. S2CID 54922537.
moderate volcanic eruptions, rather than anthropogenic influences, are the primary source of the observed increases in stratospheric aerosol.
- ^ a b Chung CE, Ramanathan V (2006). "Weakening of North Indian SST Gradients and the Monsoon Rainfall in India and the Sahel". Journal of Climate. 19 (10): 2036–2045. Bibcode:2006JCli...19.2036C. doi:10.1175/JCLI3820.1. S2CID 10435613.
- ^ "Pollutants and Their Effect on the Water and Radiation Budgets". Archived from the original on 16 December 2008.
- ^ "Australian rainfall and Asian aerosols" (PDF). Archived from the original (PDF) on 16 June 2012.
- ^ Region 4: Laboratory and Field Operations – PM 2.5 (2008).PM 2.5 Objectives and History. U.S. Environmental Protection Agency.
- ^ Balmes, John R.; Fine, Jonathan M.; Sheppard, Dean (November 1987). "Symptomatic Bronchoconstriction after Short-Term Inhalation of Sulfur Dioxide". American Review of Respiratory Disease. 136 (5): 1117–1121. doi:10.1164/ajrccm/136.5.1117. PMID 3674573.
- ^ Nieuwenhuijsen, M.J. (2003). Exposure Assessment in Occupational and Environmental Epidemiology. London: Oxford University Press.[page needed]
- ^ "Pollution Particles Lead to Higher Heart Attack Risk". Bloomberg L.P. 17 January 2008. Archived from the original on 29 June 2011.
The pollutants, abundant in urban areas, are less than 0.18 micrometers in size and cause four times more artery buildup than particles four times larger, said Jesus Araujo, director of environmental cardiology at University of California, Los Angeles.
- ^ Araujo, Jesus A.; et al. (17 January 2008). "Ambient Particulate Pollutants in the Ultrafine Range Promote Early Atherosclerosis and Systemic Oxidative Stress". Circulation Research. 102 (5): 589–596. doi:10.1161/CIRCRESAHA.107.164970. PMC 3014059. PMID 18202315.
- ^ Hennig, Frauke; Quass, Ulrich; Hellack, Bryan; Küpper, Miriam; Kuhlbusch, Thomas A. J.; Stafoggia, Massimo; Hoffmann, Barbara (February 2018). "Ultrafine and Fine Particle Number and Surface Area Concentrations and Daily Cause-Specific Mortality in the Ruhr Area, Germany, 2009–2014". Environmental Health Perspectives. 126 (2): 027008. doi:10.1289/EHP2054. ISSN 0091-6765. PMC 6066351. PMID 29467106.
- ^ De Jesus, Alma Lorelei; et al. (2019). "Ultrafine particles and PM2.5 in the air of cities around the world: Are they representative of each other?". Environment International. 129: 118–135. doi:10.1016/j.envint.2019.05.021. PMID 31125731. S2CID 164216753.
- ^ Lippmann, M., Cohen, B.S., Schlesinger, R.S. (2003). Environmental Health Science. New York: Oxford University Press.[page needed]
- ^ "Scattering Matrix for Typical Urban Anthropogenic Origin Cement Dust and Discrimination of Representative Atmospheric Particulates".
- ^ "The dangers of a scrap yard fire in your community". 10 October 2022.
- ^ "Cargo boat fire put out in Hong Kong's Victoria Harbour after burning for 15 hours and sending fumes across city". 3 June 2021.
- ^ "Stench from burning metal-waste ship blows across HK".
- ^ "Electric Arc Furnace (EAF) Slag". 3 June 2021.
- ^ Nair, Abhilash T.; Mathew, Aneesh; a r, Archana; Akbar, M Abdul (2022). "Use of hazardous electric arc furnace dust in the construction industry: A cleaner production approach". Journal of Cleaner Production. 377: 134282. Bibcode:2022JCPro.37734282N. doi:10.1016/j.jclepro.2022.134282. S2CID 252553231.
- ^ "Sustainability".
- ^ "Hong Kong Housing Authority Sustainability Report 2012/13" (PDF). Archived from the original (PDF) on 28 June 2023.
- ^ "Hong Kong Housing Authority - Environmental Report 2020/21". Archived from the original on 28 June 2023.
- ^ "Cement industry news from Global Cement". Archived from the original on 3 December 2022.
- ^ "黑水泥厂"围城" 打假队一年揪出13家" [City "besieged" with dishonest cement factories, anti-counterfeiting teams found 13 of them in one year] (in Chinese).
- ^ "Growing Importance of Slag Cement in the Global Cement Industry". 6 July 2022.
- ^ "房市新制大調查 爐渣屋掰 2021年起禁用爐渣" [A look into the property market new regulations. No more slag house. Slag will be banned from 2021] (in Chinese). 10 December 2020.
- ^ "新版預售屋契約禁用「煉鋼爐碴」 建商違規將挨罰" [The new version of the pre-sale house contract prohibits "steelmaking furnace slag" and builders will be fined for violations] (in Chinese). 8 May 2019.
- ^ "Welding - Fumes And Gases, OSH Answers". 10 February 2023.
- ^ Li Y, Chen J, Bu S, Wang S, Geng X, Guan G, Zhao Q, Ao L, Qu W, Zheng Y, Jin Y, Tang J (May 2021). "Blood lead levels and their associated risk factors in Chinese adults from 1980 to 2018". Ecotoxicol Environ Saf. 218: 112294. Bibcode:2021EcoES.21812294L. doi:10.1016/j.ecoenv.2021.112294. PMID 33984660.
- ^ Han Z, Guo X, Zhang B, Liao J, Nie L (June 2018). "Blood lead levels of children in urban and suburban areas in China (1997-2015): Temporal and spatial variations and influencing factors". Sci Total Environ. 625: 1659–1666. Bibcode:2018ScTEn.625.1659H. doi:10.1016/j.scitotenv.2017.12.315. PMID 29996461. S2CID 51617692.
- ^ Ren, J.; Tang, M.; Novoselac, A. (2022). "Experimental study to quantify airborne particle deposition onto and resuspension from clothing using a fluorescent-tracking method". Building and Environment. 209: 108580. Bibcode:2022BuEnv.20908580R. doi:10.1016/j.buildenv.2021.108580. PMC 8620412. PMID 34848915.
- ^ "地盤工滿身泥衣鞋入茶餐廳 網民批成身水泥累慘清潔工:做死阿姐". 香港01 (in Chinese). 20 July 2023. Retrieved 14 August 2023.
- ^ Ostro, B.; Tobias, A.; Querol, X.; Alastuey, A.; Amato, F.; Pey, J.; Pérez, N.; Sunyer, J. (2011). "The effects of particulate matter sources on daily mortality: a case-crossover study of Barcelona, Spain". Environmental Health Perspectives. 119 (12): 1781–1787. doi:10.1289/ehp.1103618. PMC 3261985. PMID 21846610.
- ^ "10-year Hospital Development Plan".
- ^ "Architectural Services Department - Capital Projects Under Construction".
- ^ Renard, J. B.; Surcin, J.; Annesi-Maesano, I.; Delaunay, G.; Poincelet, E.; Dixsaut, G. (2022). "Relation between PM2.5 pollution and Covid-19 mortality in Western Europe for the 2020–2022 period". The Science of the Total Environment. 848: 157579. Bibcode:2022ScTEn.84857579R. doi:10.1016/j.scitotenv.2022.157579. PMC 9310379. PMID 35901896.
- ^ Perone, Gaetano (2022). "Assessing the impact of long-term exposure to nine outdoor air pollutants on COVID-19 spatial spread and related mortality in 107 Italian provinces". Scientific Reports. 12 (1): 13317. Bibcode:2022NatSR..1213317P. doi:10.1038/s41598-022-17215-x. PMC 9349267. PMID 35922645.
- ^ Kiser, Daniel; Elhanan, Gai; Metcalf, William J.; Schnieder, Brendan; Grzymski, Joseph J. (2021). "SARS-CoV-2 test positivity rate in Reno, Nevada: Association with PM2.5 during the 2020 wildfire smoke events in the western United States". Journal of Exposure Science & Environmental Epidemiology. 31 (5): 797–803. Bibcode:2021JESEE..31..797K. doi:10.1038/s41370-021-00366-w. PMC 8276229. PMID 34257389.
- ^ Solimini, Angelo; Filipponi, F.; Fegatelli, D. Alunni; Caputo, B.; De Marco, C. M.; Spagnoli, A.; Vestri, A. R. (2021). "A global association between Covid-19 cases and airborne particulate matter at regional level". Scientific Reports. 11 (1): 6256. doi:10.1038/s41598-021-85751-z. PMC 7973572. PMID 33737616.
- ^ "With metals and maybe even coronavirus, wildfire smoke is more dangerous than you think". Los Angeles Times. 22 July 2021.
- ^ "Silicosis, OSH Answers Fact Sheets". 13 June 2023.
- ^ Preventing Silicosis and Deaths From Sandblasting (Report). Centers for Disease Control and Prevention. 1992. doi:10.26616/NIOSHPUB92102.
- ^ a b Flores-Pajot, Marie-Claire; Ofner, Marianna; Do, Minh T.; Lavigne, Eric; Villeneuve, Paul J. (November 2016). "Childhood autism spectrum disorders and exposure to nitrogen dioxide, and particulate matter air pollution: A review and meta-analysis". Environmental Research. 151: 763–776. Bibcode:2016ER....151..763F. doi:10.1016/j.envres.2016.07.030. PMID 27609410.
- ^ a b Chun, HeeKyoung; Leung, Cheryl; Wen, Shi Wu; McDonald, Judy; Shin, Hwashin H. (January 2020). "Maternal exposure to air pollution and risk of autism in children: A systematic review and meta-analysis". Environmental Pollution. 256: 113307. Bibcode:2020EPoll.25613307C. doi:10.1016/j.envpol.2019.113307. PMID 31733973.
- ^ a b Lam, Juleen; Sutton, Patrice; Kalkbrenner, Amy; Windham, Gayle; Halladay, Alycia; Koustas, Erica; Lawler, Cindy; Davidson, Lisette; Daniels, Natalyn; Newschaffer, Craig; Woodruff, Tracey (21 September 2016). "A Systematic Review and Meta-Analysis of Multiple Airborne Pollutants and Autism Spectrum Disorder". PLOS ONE. 11 (9): e0161851. Bibcode:2016PLoSO..1161851L. doi:10.1371/journal.pone.0161851. PMC 5031428. PMID 27653281.
- ^ a b Weisskopf, Marc G.; Kioumourtzoglou, Marianthi-Anna; Roberts, Andrea L. (December 2015). "Air Pollution and Autism Spectrum Disorders: Causal or Confounded?". Current Environmental Health Reports. 2 (4): 430–439. Bibcode:2015CEHR....2..430W. doi:10.1007/s40572-015-0073-9. PMC 4737505. PMID 26399256.
- ^ a b Fu, Pengfei; Yung, Ken Kin Lam (15 September 2020). "Air Pollution and Alzheimer's Disease: A Systematic Review and Meta-Analysis". Journal of Alzheimer's Disease. 77 (2): 701–714. doi:10.3233/JAD-200483. PMID 32741830. S2CID 220942039.
- ^ a b Tsai, Tsung-Lin; Lin, Yu-Ting; Hwang, Bing-Fang; Nakayama, Shoji F.; Tsai, Chon-Haw; Sun, Xian-Liang; Ma, Chaochen; Jung, Chau-Ren (October 2019). "Fine particulate matter is a potential determinant of Alzheimer's disease: A systemic review and meta-analysis". Environmental Research. 177: 108638. Bibcode:2019ER....17708638T. doi:10.1016/j.envres.2019.108638. PMID 31421449. S2CID 201057595.
- ^ a b c Braithwaite, Isobel; Zhang, Shuo; Kirkbride, James B.; Osborn, David P. J.; Hayes, Joseph F. (December 2019). "Air Pollution (Particulate Matter) Exposure and Associations with Depression, Anxiety, Bipolar, Psychosis and Suicide Risk: A Systematic Review and Meta-Analysis". Environmental Health Perspectives. 127 (12): 126002. doi:10.1289/EHP4595. PMC 6957283. PMID 31850801.
- ^ a b c Lu, Jackson G (April 2020). "Air pollution: A systematic review of its psychological, economic, and social effects". Current Opinion in Psychology. 32: 52–65. doi:10.1016/j.copsyc.2019.06.024. PMID 31557706. S2CID 199147061.
- ^ a b c Liu, Qisijing; Wang, Wanzhou; Gu, Xuelin; Deng, Furong; Wang, Xueqin; Lin, Hualiang; Guo, Xinbiao; Wu, Shaowei (February 2021). "Association between particulate matter air pollution and risk of depression and suicide: a systematic review and meta-analysis". Environmental Science and Pollution Research. 28 (8): 9029–9049. Bibcode:2021ESPR...28.9029L. doi:10.1007/s11356-021-12357-3. PMID 33481201. S2CID 231677095.
- ^ Schraufnagel, Dean E.; Balmes, John R.; Cowl, Clayton T.; De Matteis, Sara; Jung, Soon-Hee; Mortimer, Kevin; Perez-Padilla, Rogelio; Rice, Mary B.; Riojas-Rodriguez, Horacio; Sood, Akshay; Thurston, George D.; To, Teresa; Vanker, Anessa; Wuebbles, Donald J. (February 2019). "Air Pollution and Noncommunicable Diseases". Chest. 155 (2): 409–416. doi:10.1016/j.chest.2018.10.042. PMC 6904855. PMID 30419235.
- ^ Carrington, Damian; McMullan, Lydia; Blight, Garry; Roberts, Simon; Hulley-Jones, Frank (17 May 2019). "Revealed: air pollution may be damaging 'every organ in the body'". The Guardian.
- ^ a b Raaschou-Nielsen, Ole; Andersen, Zorana J; Beelen, Rob; Samoli, Evangelia; Stafoggia, Massimo; Weinmayr, Gudrun; et al. (August 2013). "Air pollution and lung cancer incidence in 17 European cohorts: prospective analyses from the European Study of Cohorts for Air Pollution Effects (ESCAPE)". The Lancet Oncology. 14 (9): 813–822. doi:10.1016/S1470-2045(13)70279-1. PMID 23849838.
- ^ Cohen AJ, Ross Anderson H, Ostro B, Pandey KD, Krzyzanowski M, Künzli N, et al. (2005). "The global burden of disease due to outdoor air pollution". Journal of Toxicology and Environmental Health. Part A. 68 (13–14): 1301–7. Bibcode:2005JTEHA..68.1301C. doi:10.1080/15287390590936166. PMID 16024504. S2CID 23814778.
- ^ "Air Pollution & Cardiovascular Disease". National Institute of Environmental Health Sciences. Archived from the original on 14 May 2011.
- ^ Lave, Lester B.; Seskin, Eugene P. (June 1973). "An Analysis of the Association between U.S. Mortality and Air Pollution". Journal of the American Statistical Association. 68 (342): 284–290. doi:10.1080/01621459.1973.10482421. eISSN 1537-274X. ISSN 0162-1459.
- ^ Mokdad AH, Marks JS, Stroup DF, Gerberding JL (March 2004). "Actual causes of death in the United States, 2000". JAMA. 291 (10): 1238–45. doi:10.1001/jama.291.10.1238. PMID 15010446. S2CID 14589790.
- ^ a b European Environment Agency (2009). Spatial assessment of PM10 and ozone concentrations in Europe (2005). Publications Office. doi:10.2800/165. ISBN 978-92-9167-988-1.[page needed]
- ^ Lim SS, Vos T, Flaxman AD, Danaei G, Shibuya K, Adair-Rohani H, et al. (December 2012). "A comparative risk assessment of burden of disease and injury attributable to 67 risk factors and risk factor clusters in 21 regions, 1990-2010: a systematic analysis for the Global Burden of Disease Study 2010". Lancet. 380 (9859): 2224–60. doi:10.1016/s0140-6736(12)61766-8. PMC 4156511. PMID 23245609.
- ^ "Air pollution in Europe: These are the worst-hit cities to live in". euronews. 24 December 2021. Retrieved 1 April 2022.
- ^ Laden, F; Neas, L M; Dockery, D W; Schwartz, J (October 2000). "Association of fine particulate matter from different sources with daily mortality in six U.S. cities". Environmental Health Perspectives. 108 (10): 941–947. doi:10.1289/ehp.00108941. PMC 1240126. PMID 11049813.
- ^ Ozkaynak, Haluk; Thurston, George D. (December 1987). "Associations Between 1980 U.S. Mortality Rates and Alternative Measures of Airborne Particle Concentration". Risk Analysis. 7 (4): 449–461. Bibcode:1987RiskA...7..449O. doi:10.1111/j.1539-6924.1987.tb00482.x. PMID 3444932.
- ^ Mailloux, Nicholas A.; Abel, David W.; Holloway, Tracey; Patz, Jonathan A. (16 May 2022). "Nationwide and Regional PM2.5-Related Air Quality Health Benefits From the Removal of Energy-Related Emissions in the United States". GeoHealth. 6 (5): e2022GH000603. Bibcode:2022GHeal...6..603M. doi:10.1029/2022GH000603. PMC 9109601. PMID 35599962.
- ^ Carrington, Damian (17 February 2021). "Air pollution significantly raises risk of infertility, study finds". The Guardian.
- ^ Zhang M, Mueller NT, Wang H, Hong X, Appel LJ, Wang X (July 2018). "Maternal Exposure to Ambient Particulate Matter ≤2.5 μm During Pregnancy and the Risk for High Blood Pressure in Childhood". Hypertension. 72 (1): 194–201. doi:10.1161/HYPERTENSIONAHA.117.10944. PMC 6002908. PMID 29760154.
- ^ Sapkota A, Chelikowsky AP, Nachman KE, Cohen AJ, Ritz B (1 December 2012). "Exposure to particulate matter and adverse birth outcomes: a comprehensive review and meta-analysis". Air Quality, Atmosphere & Health. 5 (4): 369–381. Bibcode:2012AQAH....5..369S. doi:10.1007/s11869-010-0106-3. S2CID 95781433.
- ^ a b c Sacks J. "2009 Final Report: Integrated Science Assessment for Particulate Matter". US EPA National Center for Environmental Assessment, Research Triangle Park Nc, Environmental Media Assessment Group. Retrieved 31 March 2017.
- ^ Erickson AC, Arbour L (26 November 2014). "The shared pathoetiological effects of particulate air pollution and the social environment on fetal-placental development". Journal of Environmental and Public Health. 2014: 901017. doi:10.1155/2014/901017. PMC 4276595. PMID 25574176.
- ^ Lee PC, Talbott EO, Roberts JM, Catov JM, Bilonick RA, Stone RA, et al. (August 2012). "Ambient air pollution exposure and blood pressure changes during pregnancy". Environmental Research. 117: 46–53. Bibcode:2012ER....117...46L. doi:10.1016/j.envres.2012.05.011. PMC 3656658. PMID 22835955.
- ^ Woodruff TJ, Parker JD, Darrow LA, Slama R, Bell ML, Choi H, et al. (April 2009). "Methodological issues in studies of air pollution and reproductive health". Environmental Research. 109 (3): 311–320. Bibcode:2009ER....109..311W. doi:10.1016/j.envres.2008.12.012. PMC 6615486. PMID 19215915.
- ^ Byrne CD, Phillips DI (November 2000). "Fetal origins of adult disease: epidemiology and mechanisms". Journal of Clinical Pathology. 53 (11): 822–8. doi:10.1136/jcp.53.11.822. PMC 1731115. PMID 11127263.
- ^ Barker DJ (November 1990). "The fetal and infant origins of adult disease". BMJ. 301 (6761): 1111. doi:10.1136/bmj.301.6761.1111. PMC 1664286. PMID 2252919.
- ^ Pope CA, Burnett RT, Thun MJ, Calle EE, Krewski D, Ito K, Thurston GD (March 2002). "Lung cancer, cardiopulmonary mortality, and long-term exposure to fine particulate air pollution". JAMA. 287 (9): 1132–41. doi:10.1001/jama.287.9.1132. PMC 4037163. PMID 11879110.
- ^ EU's PM2.5 Limit Festering: New Study Linked PM with Heart Attack Cesaroni G, Forastiere F, Stafoggia M, Andersen ZJ, Badaloni C, Beelen R, et al. (January 2014). "Long term exposure to ambient air pollution and incidence of acute coronary events: prospective cohort study and meta-analysis in 11 European cohorts from the ESCAPE Project". BMJ. 348: f7412. doi:10.1136/bmj.f7412. PMC 3898420. PMID 24452269.
- ^ Hussey SJ, Purves J, Allcock N, Fernandes VE, Monks PS, Ketley JM, et al. (May 2017). "Air pollution alters Staphylococcus aureus and Streptococcus pneumoniae biofilms, antibiotic tolerance and colonisation" (PDF). Environmental Microbiology. 19 (5): 1868–1880. Bibcode:2017EnvMi..19.1868H. doi:10.1111/1462-2920.13686. PMC 6849702. PMID 28195384.
- ^ "National Study Examines Health Risks of Coarse Particle Pollution". www.newswise.com.
- ^ "Mongolia: Ulaanbaatar Air Pollution Linked to Public Health Crisis".
- ^ Matthews, Dylan (27 December 2021). "How humans could live two years longer". Vox.
- ^ Symons, Angela (15 December 2022). "Suicide rates rise as air quality worsens, study finds". euronews. Retrieved 19 December 2022.
- ^ Fan, Shu-Jun; Heinrich, Joachim; Bloom, Michael S.; Zhao, Tian-Yu; Shi, Tong-Xing; Feng, Wen-Ru; Sun, Yi; Shen, Ji-Chuan; Yang, Zhi-Cong; Yang, Bo-Yi; Dong, Guang-Hui (January 2020). "Ambient air pollution and depression: A systematic review with meta-analysis up to 2019". Science of the Total Environment. 701: 134721. Bibcode:2020ScTEn.70134721F. doi:10.1016/j.scitotenv.2019.134721. PMID 31715478. S2CID 207944384. Archived from the original on 31 March 2022. Retrieved 26 January 2022.
- ^ Maher, Barbara A.; Ahmed, Imad A. M.; Karloukovski, Vassil; MacLaren, Donald A.; Foulds, Penelope G.; Allsop, David; Mann, David M. A.; Torres-Jardón, Ricardo; Calderon-Garciduenas, Lilian (27 September 2016). "Magnetite pollution nanoparticles in the human brain". Proceedings of the National Academy of Sciences. 113 (39): 10797–10801. Bibcode:2016PNAS..11310797M. doi:10.1073/pnas.1605941113. PMC 5047173. PMID 27601646.
- ^ "Parkinson's Disease".
- ^ Kanninen, K. M.; Lampinen, R.; Rantanen, L. M.; Odendaal, L.; Jalava, P.; Chew, S.; White, A. R. (1 June 2020). "Olfactory cell cultures to investigate health effects of air pollution exposure: Implications for neurodegeneration". Neurochemistry International. 136: 104729. doi:10.1016/j.neuint.2020.104729. PMID 32201281. S2CID 214585295 – via ScienceDirect.
- ^ Cohen AJ, Ross Anderson H, Ostro B, Pandey KD, Krzyzanowski M, Künzli N, et al. (2005). "The global burden of disease due to outdoor air pollution". Journal of Toxicology and Environmental Health. Part A. 68 (13–14): 1301–7. Bibcode:2005JTEHA..68.1301C. doi:10.1080/15287390590936166. PMID 16024504. S2CID 23814778.
- ^ Nawrot TS, Perez L, Künzli N, Munters E, Nemery B (February 2011). "Public health importance of triggers of myocardial infarction: a comparative risk assessment". Lancet. 377 (9767): 732–40. doi:10.1016/S0140-6736(10)62296-9. PMID 21353301. S2CID 20168936. "Taking into account the OR and the prevalences of exposure, the highest PAF was estimated for traffic exposure (7.4%)... ":"... [O]dds ratios and frequencies of each trigger were used to compute population-attributable fractions (PAFs), which estimate the proportion of cases that could be avoided if a risk factor were removed. PAFs depend not only on the risk factor strength at the individual level but also on its frequency in the community. ... [T]he exposure prevalence for triggers in the relevant control time window ranged from 0.04% for cocaine use to 100% for air pollution. ... Taking into account the OR and the prevalences of exposure, the highest PAF was estimated for traffic exposure (7.4%) ...
- ^ "Resources and Information" (PDF). ww16.baq2008.org. Archived from the original (PDF) on 17 December 2008.
- ^ a b Smiley, Kevin T. (2019). "Racial and Environmental Inequalities in Spatial Patterns in Asthma Prevalence in the US South". Southeastern Geographer. 59 (4): 389–402. doi:10.1353/sgo.2019.0031. S2CID 210244838. Project MUSE 736789.
- ^ "Erratum: Eur. Phys. J. C.22, 695–705 (2002) – DOI 10.1007/s100520100827 Published online: 7 December 2001". The European Physical Journal C. 24 (4): 665–666. August 2002. Bibcode:2002EPJC...24..665.. doi:10.1007/s10052-002-0987-x. S2CID 195313204.
- ^ a b Mikati, Ihab; Benson, Adam F.; Luben, Thomas J.; Sacks, Jason D.; Richmond-Bryant, Jennifer (1 April 2018). "Disparities in Distribution of Particulate Matter Emission Sources by Race and Poverty Status". American Journal of Public Health. 108 (4): 480–485. doi:10.2105/AJPH.2017.304297. PMC 5844406. PMID 29470121.
- ^ "Urban Air Pollution and Health Inequities: A Workshop Report". Environmental Health Perspectives. 109 (s3): 357–374. 1 June 2001. doi:10.1289/ehp.01109s3357.
- ^ a b c Jervis, Rick; Gomez, Alan (12 October 2020). "Racism turned their neighborhood into 'Cancer Alley.' Now they're dying from COVID-19". USA Today.
- ^ US EPA, OAR (12 November 2018). "How Smoke from Fires Can Affect Your Health". US EPA. Retrieved 26 November 2020.
- ^ Wegesser TC, Pinkerton KE, Last JA (June 2009). "California wildfires of 2008: coarse and fine particulate matter toxicity". Environmental Health Perspectives. 117 (6): 893–7. doi:10.1289/ehp.0800166. PMC 2702402. PMID 19590679.
- ^ Haikerwal A, Akram M, Del Monaco A, Smith K, Sim MR, Meyer M, et al. (July 2015). "Impact of Fine Particulate Matter (PM2.5) Exposure During Wildfires on Cardiovascular Health Outcomes". Journal of the American Heart Association. 4 (7): e001653. doi:10.1161/JAHA.114.001653. PMC 4608063. PMID 26178402.
- ^ Reid CE, Considine EM, Watson GL, Telesca D, Pfister GG, Jerrett M (August 2019). "Associations between respiratory health and ozone and fine particulate matter during a wildfire event". Environment International. 129: 291–298. Bibcode:2019EnInt.129..291R. doi:10.1016/j.envint.2019.04.033. PMID 31146163.
- ^ Haikerwal A, Akram M, Sim MR, Meyer M, Abramson MJ, Dennekamp M (January 2016). "Fine particulate matter (PM2.5 ) exposure during a prolonged wildfire period and emergency department visits for asthma". Respirology. 21 (1): 88–94. doi:10.1111/resp.12613. PMID 26346113. S2CID 22910313.
- ^ DeFlorio-Barker S, Crooks J, Reyes J, Rappold AG (March 2019). "Cardiopulmonary Effects of Fine Particulate Matter Exposure among Older Adults, during Wildfire and Non-Wildfire Periods, in the United States 2008-2010". Environmental Health Perspectives. 127 (3): 37006. doi:10.1289/EHP3860. PMC 6768318. PMID 30875246.
- ^ Jiang, Kevin (27 June 2023). "What is 'smoke brain'? How air pollution can harm our cognition and mental health". Toronto Star.
- ^ Ritchie, Hannah; Roser, Max (2021). "What are the safest and cleanest sources of energy?". Our World in Data. Archived from the original on 15 January 2024. Data sources: Markandya & Wilkinson (2007); UNSCEAR (2008; 2018); Sovacool et al. (2016); IPCC AR5 (2014); Pehl et al. (2017); Ember Energy (2021).
- ^ a b The Guardian, 18 March 2021 "Oil Firms Knew Decades Ago Fossil Fuels Posed Grave Health Risks, Riles Reveal; Exclusive: Documents Seen by Guardian Show Companies Fought Clean-Air Rules Despite Being Aware of Harm Caused by Air Pollution"
- ^ The Guardian "75 Ways Trump Made America Dirtier and the Planet Warmer: In the Past Four Years, Trump has Shredded Environmental Protections for American Lands, Animals and People"
- ^ Union of Concerned Scientists, 27 April 2020 "Oil Industry Ghostwrites Trump's Deadly Anti-Environmental Policies"
- ^ Hogan CM (2010). Emily Monosson and C. Cleveland (ed.). "Abiotic factor". Encyclopedia of Earth. National Council for Science and the Environment.
- ^ US EPA, OAR (26 April 2016). "Health and Environmental Effects of Particulate Matter (PM)". US EPA. Retrieved 5 October 2019.
- ^ Hamra GB, Guha N, Cohen A, Laden F, Raaschou-Nielsen O, Samet JM, et al. (September 2014). "Outdoor particulate matter exposure and lung cancer: a systematic review and meta-analysis". Environmental Health Perspectives. 122 (9): 906–11. doi:10.1289/ehp.1408092. PMC 4154221. PMID 24911630.
- ^ Department of the Environment (25 February 2016). "National Environment Protection (Ambient Air Quality) Measure". Federal Register of Legislation. Retrieved 16 November 2018.
- ^ "Ambient air quality standards" (PDF). Archived (PDF) from the original on 30 April 2013. Retrieved 30 April 2013.
- ^ a b "Air Quality Standards – Environment – European Commission". Ec.europa.eu. Retrieved 1 February 2015.
- ^ "Air Quality Objectives". Environmental Protection Department, Hong Kong. 19 December 2012. Retrieved 27 July 2013.
- ^ "微小粒子状物質(PM2.5)対策|東京都環境局 大気・騒音・振動・悪臭対策". Kankyo.metro.tokyo.jp. Archived from the original on 28 February 2015. Retrieved 1 February 2015.
- ^ "Air Quality Standards" (PDF).
- ^ "Home". airkorea.or.kr.
- ^ "미세먼지 환경기준 선진국 수준 강화...'나쁨' 4배 늘 듯".
- ^ "細懸浮微粒管制". Environmental Protection Administration, ROC. Retrieved 16 November 2015.
- ^ "FEATURE: Air pollution reason for concern: groups - Taipei Times". www.taipeitimes.com. 5 February 2014.
- ^ a b "Pm Naaqs | Us Epa". Epa.gov. Retrieved 1 February 2015.
- ^ "Environmental Protection Agency – Particulate Matter (PM-10)". Epa.gov. 28 June 2006. Retrieved 1 February 2015.
- ^ "WHO global air quality guidelines" (PDF). WHO.
- ^ "Canadian Ambient Air Quality Standards (CAAQS) for Fine Particulate Matter (PM2.5) and Ozone" (PDF). Archived from the original (PDF) on 20 December 2016. Retrieved 11 December 2016.
- ^ "Burn better: Making changes for cleaner air".
- ^ "Guidance for wood burning in London".
- ^ "Log burners: What are the new rules and are they going to be banned?". Independent.co.uk. 6 February 2023.
- ^ Air Quality Trends - How to Interpret the Graphs
- ^ "Nanotechnology web page". Department of Toxic Substances Control. 2008. Archived from the original on 1 January 2010.
- ^ a b "Chemical Information Call-In web page". Department of Toxic Substances Control. 2008. Archived from the original on 18 March 2010. Retrieved 28 December 2009.
- ^ Wong J (22 January 2009), Call in letter (PDF), archived from the original (PDF) on 27 January 2017, retrieved 28 December 2009
- ^ "Contact List for CNT January 22 & 26 2009 Document" (PDF). Archived from the original (PDF) on 31 January 2017. Retrieved 28 December 2009.
- ^ "Archived DTSC Nanotechnology Symposia". Department of Toxic Substances Control. Archived from the original on 1 January 2010.
- ^ Chemical Information Call-in: Nanomaterials dtsc.ca.gov Archived 1 January 2010 at the Wayback Machine
- ^ a b c "The Cities Where Air Pollution Has Increased and Decreased the Most since 2019". 20 February 2023.
- ^ "Mapped: New Survey Shows Air Pollution Changes In Cities Around The World". Forbes.
- ^ Oliver Milman (1 April 2015). "Call for action on pollution as emissions linked to respiratory illnesses double". The Guardian. Retrieved 3 April 2015.
emissions of a key pollutant linked to respiratory illness have doubled over the past five years
- ^ Li, Jie; Du, Huiyun; Wang, Zifa; Sun, Yele; Yang, Wenyi; Li, Jianjun; Tang, Xiao; Fu, Pingqing (1 April 2017). "Rapid formation of a severe regional winter haze episode over a mega-city cluster on the North China Plain". Environmental Pollution. 223: 605–615. Bibcode:2017EPoll.223..605L. doi:10.1016/j.envpol.2017.01.063. ISSN 0269-7491. PMID 28159396.
- ^ Zhong, Junting; Zhang, Xiaoye; Gui, Ke; Liao, Jie; Fei, Ye; Jiang, Lipeng; Guo, Lifeng; Liu, Liangke; Che, Huizheng; Wang, Yaqiang; Wang, Deying; Zhou, Zijiang (12 July 2022). "Reconstructing 6-hourly PM2.5 datasets from 1960 to 2020 in China". Earth System Science Data. 14 (7): 3197–3211. Bibcode:2022ESSD...14.3197Z. doi:10.5194/essd-14-3197-2022. ISSN 1866-3508. S2CID 250512127.
- ^ "China: annual PM2.5 levels Beijing 2022". Statista. Retrieved 1 April 2023.
- ^ Consulate General of the United States of America Guangzhou, China (n.d.). "U.S. Consulate Air Quality Monitor and StateAir". U.S. Department of State. Archived from the original on 1 July 2011. Retrieved 24 December 2014.
- ^ "Armed With NASA Data, South Korea Confronts Its Choking Smog". NPR.
- ^ "NASA and NIER study finds that 48% of particulate matter comes from outside S. Korea".
- ^ "China, South Korea build environment cooperation". 26 June 2018.
- ^ "Air pollution chokes Thailand as campaigners call for stricter laws". 27 March 2023.
- ^ "Air pollution hospitalises 200,000 in one week as fumes, emissions and smoke descend on Thailand". 13 March 2023.
- ^ "Ambient (outdoor) air pollution". www.who.int.
- ^ "Aviation Pollution".
- ^ "Chapter 1 - Fly Ash - An Engineering Material - Fly Ash Facts for Highway Engineers - Recycling - Sustainability - Pavements - Federal Highway Administration". Federal Highway Administration (FHWA).
- ^ "City Rankings, State of the Air, American Lung Association".
- ^ "The Dirtiest And Cleanest Cities In America (The Worst Will Surprise You)". Forbes.
- ^ "An N95 Mask Is Your Best Defense Against Wildfire Smoke | Time". 7 June 2023.
Further reading
Control
- "Best Practices for Indoor Air Quality when Remodeling Your Home". US EPA. 7 January 2015.
- "Examples of how to manage dust in the workplace". EPA Victoria.
Health
- Carrington, Damian (17 September 2019). "Air pollution particles found on foetal side of placentas – study". TheGuardian.com.
- Liu XQ, Huang J, Song C, Zhang TL, Liu YP, Yu L (2023). "Neurodevelopmental toxicity induced by PM2.5 Exposure and its possible role in Neurodegenerative and mental disorders". Hum Exp Toxicol. 42: 9603271231191436. Bibcode:2023HETox..4291436L. doi:10.1177/09603271231191436. PMID 37537902. S2CID 260485784.
- InsideEPA.com, Study Links Air Toxics To Heart Disease In Mice Amid EPA Controversy[dead link]
- G Invernizzi et al., Particulate matter from tobacco versus diesel car exhaust: an educational perspective. Tobacco Control 13, S.219–221 (2004)
- Hunt, A.; Abraham, J. L.; Judson, B.; Berry, C. L. (2003). "Toxicologic and epidemiologic clues from the characterization of the 1952 London smog fine particulate matter in archival autopsy lung tissues". Environmental Health Perspectives. 111 (9): 1209–1214. doi:10.1289/ehp.6114. PMC 1241576. PMID 12842775.
More
- "Particulate Pollution Course". US EPA. 12 September 2014.
- Voiland, Adam. "Aerosols: Tiny Particles, Big Impact." NASA, 2 November 2010, Aerosols: Tiny Particles, Big Impact
- The Intergovernmental Panel on Climate Change (the principal international scientific body on climate change) chapter on atmospheric aerosols and their radiative effects
- Preining, Othmar and E. James Davis (eds.), "History of Aerosol Science," Österreichische Akademie der Wissenschaften, ISBN 3-7001-2915-7 (Pbk.)
- Jelonek Z, Drobniak A, Mastalerz M, Jelonek I (December 2020). "Environmental implications of the quality of charcoal briquettes and lump charcoal used for grilling". Sci Total Environ. 747: 141267. Bibcode:2020ScTEn.74741267J. doi:10.1016/j.scitotenv.2020.141267. PMID 32777507. S2CID 221100463.
- Hinds, William C., Aerosol Technology: Properties, Behavior, and Measurement of Airborne Particles, Wiley-Interscience, ISBN 0-471-19410-7
- Zangari, Shelby et al., Air quality changes in New York City during the COVID-19 pandemic. Science of the Total Environment 742 (2020)
- NARSTO (2004) Particulate Matter Science for Policy Makers: A NARSTO Assessment. P. McMurry, M. Shepherd, and J. Vickery, eds. Cambridge University Press, Cambridge, England. ISBN 0 52 184287 5.
- "70 years since the great London smog 1952, air quality in a modern context". 5 December 2022.
- "A Major Source of Air Pollution: Farms - The Earth Institute".
- "Hong Kong's illegal barbecue site something to chew on | South China Morning Post". 4 December 2021.
- Alves, Célia A.; Evtyugina, Margarita; Vicente, Estela; Vicente, Ana; Gonçalves, Cátia; Neto, Ana Isabel; Nunes, Teresa; Kováts, Nora (15 September 2022). "Outdoor charcoal grilling: Particulate and gas-phase emissions, organic speciation and ecotoxicological assessment - ScienceDirect". Atmospheric Environment. 285: 119240. doi:10.1016/j.atmosenv.2022.119240. S2CID 249860528.
- Papachristopoulou, Kyriakoula; Raptis, Ioannis-Panagiotis; Gkikas, Antonis; Fountoulakis, Ilias; Masoom, Akriti; Kazadzis, Stelios (2022). "Aerosol optical depth regime over megacities of the world". Atmospheric Chemistry and Physics. 22 (24): 15703–15727. Bibcode:2022ACP....2215703P. doi:10.5194/acp-22-15703-2022.
- Ogasa, Nikk (2021). "Air pollution helps wildfires create their own lightning". Science. doi:10.1126/science.abj6782. S2CID 236389007.
- "The Weight of Numbers: Air Pollution and PM2.5". Undark Magazine. Retrieved 27 September 2019.
- JEFF CHARLTON Pandemic planning: a review of respirator and mask protection levels.
External links
Control
- Control of dust from construction and demolition activities
- Controlling construction dust with on-tool extraction (4 page PDF with photos)
- Beware of dust - Hilti Canada | Dust control - Hilti Hong Kong
- What is Local Exhaust Ventilation (LEV)?
- Welding fume: protect your workers
- Environmental Toolbox Training Kit from the Hong Kong Construction Association with many illustrated useful tips on particle pollution control. Archived from original on 3 July 2023.
Others
- NASA's Earth Minute: My Name is Aerosol
- SARS-CoV-2 Aerosol Mechanisms, The Aerosol Society
- Current global map of PM1 distribution | Current global map of PM1 and PM2.5 distribution | Current global map of PM1, PM2.5 and PM10 distribution
- Current global map of the aerosol optical thickness of organic matter in green light
- Real time air quality | About
- Air quality map | About
- Pollution Facts by Air Quality Life Index
- Health Effects of Air Pollutants. EPD HK. *Archived from original on 5 January 2014.
- Sources of Respirable and Fine Suspended Particulates. EPD HK. *Archived from original on 21 September 2024.
- Precision Environmental Health's role in preventing disease