
Loading article…
世界の人口の約4%を占める米国は、インドと中国に次いで3番目に人口の多い国であり、南北アメリカ大陸と西半球では最も人口の多い国です。米国国勢調査局によると、2025年7月1日時点の推定人口は3億4178万4857人でした。[ 1 ]純国際移民の減少により、2024年から2025年の間に米国の人口は180万人、つまり0.5%増加しました。[ 3 ]前年、国勢調査局は2023年から2024年の間に人口が0.98%増加したと報告しており、[ 26 ]世界の人口増加率1.03%に近いものでした。[ 27 ]これらの数字には、 50の州と連邦首都ワシントンDCが含まれていますが、5つの非法人米国領(プエルトリコ、グアム、米領バージン諸島、アメリカ領サモア、北マリアナ諸島)の360万人の住民と、いくつかの小さな無人島領は除外されています。人種や民族的背景、宗教的所属、農村部と都市部の格差の割合など、いくつかの指標から、イリノイ州は米国全体の人口構成を最もよく代表しています。[ 28 ]
20世紀中に米国の人口はほぼ4倍になり、 1900年の約7600万人から 2000年には2億8100万人へと、年間平均約1.3%の成長率で増加しました。 [ 29 ] 1967年には2億人、 2006年10月17日には3億人に達したと推定されています。 [ 29 ] [ 30 ]外国生まれの移民により、米国の人口は急速な増加を続け、1990年の約2000万人から2015年に は4500万人以上に倍増し、 [ 31 ]人口増加の3分の1を占めています。[ 32 ]米国国勢調査局は2024年後半に、米国への最近の移民が同国の出生率の低下を相殺する以上に影響を与えていると報告した。「純国際移民が人口動向に与える影響はここ数年で増大している。2021年以降、純国際移民は国の人口増加の大部分を占めており、自然増加が主な要因であった過去20年間とは異なっている。」この結果、2022年、2023年、2024年の米国人口はそれぞれ増加した(+0.58%、+0.83%、+0.98%)。しかし、純国際移民は2025年に過去最低を記録し、同年の米国人口増加も低下した(+0.5%)。[ 33 ] [ 3 ]
人口増加は全体として少数民族の間で最も速く、2020年の米国国勢調査局の分析によると、18歳未満の米国の子どもの50%が少数民族グループに属している。[ 34 ] 2020年現在、白人アメリカ人は2億3541万1507人で、人口の71%を占めており、これには他の人種と組み合わさって白人であると自認する人も含まれる。白人のみであると自認する人(ヒスパニック系白人を含む)は2億427万7273人で、人口の61.6%を占め、非ラテン系白人は国の人口の57.8%を占めている。[ 35 ]
2010年から2020年の間に、ラテン系アメリカ人が米国全体の人口増加の51.1%を占めた。 [ 36 ]ヒスパニックまたはラテン系の人口は、2010年の5050万人から2020年には6210万人に増加し、23%の増加、1160万人以上の増加となった。[ 36 ]移民とその米国生まれの子孫は、今後数十年間の米国人口増加の大部分を占めると予想されている。[ 37 ]
アジア系アメリカ人は米国で最も急速に増加している人種グループであり、増加率は35%です。しかし、多民族のアジア系アメリカ人は最も急速に増加しているサブグループであり、増加率は55%で、これは米国における異人種間結婚の増加を反映しています。[ 38 ] [ 39 ]
2026年現在暫定データによると、白人アメリカ人母親による出生数は米国全体の約50%を占めている。黒人アメリカ人およびアジア系アメリカ人母親の出生率は引き続き低下しており、両グループとも米国の平均を大きく下回っているため、2020年以降、合計特殊出生率は緩やかに低下している。米国は高所得国の中でも出生率が最も高い国の一つであり続けている。[ 40 ]

1900年、アメリカの人口が7600万人だったとき、アメリカには6680万人の白人アメリカ人がおり、これは全人口の88%を占めていた[ 42 ]。黒人アメリカ人は880 万人で、その約90%は依然として南部諸州に住んでいた[ 43 ]。ヒスパニック系は50万人強だった[ 44 ] 。
連邦法である1965年移民国籍法[ 45 ]に基づき、米国に居住する第一世代移民の数は増加し[46]、1970年の960万人から2007年には約3800万人に達した[ 47 ]。 1990年代には年間約100万人が合法的に米国に移住したが、これは1950年代の年間25万人から増加している[ 48 ] 。
1900年、非ヒスパニック系白人は米国上位10都市の人口のほぼ97%を占めていた。[ 49 ]国勢調査局の報告によると、2010年7月から2011年7月の間に米国で生まれた子供のうち、少数民族(ヒスパニック系白人を含む)が50.4%を占めており、[ 50 ] 1990年には37%であった。[ 51 ]
2014年、出生率が最も低かった州はロードアイランド州で1.56、最も高かったのはユタ州で2.33でした。[ 52 ]これは、各州の人口の年齢構成と相関しています。ロードアイランド州は米国で9番目に高齢の中央値( 39.2歳)であるのに対し、ユタ州は最も若く29.0歳です。[ 53 ]
2017年、米国の出生率は、人口減少を避けるために必要な最低水準(女性一人当たり少なくとも2.1人)を大きく下回ったままであり、白人アメリカ人の出生数は全50州とコロンビア特別区で減少した。非ヒスパニック系白人女性では、出生率が人口置換水準を上回った州はなかった。非ヒスパニック系黒人女性では、12州が必要な人口置換水準を上回った。ヒスパニック系女性では、29州が上回った。[ 54 ]非ヒスパニック系白人女性の場合、合計特殊出生率が最も高かったのはユタ州で2.099、最も低かったのはコロンビア特別区で1.012だった。非ヒスパニック系黒人女性の場合、合計特殊出生率が最も高かったのはメイン州で4.003、最も低かったのはワイオミング州で1.146だった。ヒスパニック系女性の合計特殊出生率はアラバマ州が3.085で最も高く、バーモント州が1.200、メイン州が1.281で最も低かった。[ 54 ] [ 55 ] 2016年現在、高齢化、出生率の低下、薬物過剰摂取などによる死亡率の上昇により、国内の半数以上の州で非ヒスパニック系白人の死亡者数が出生者数を上回っている。 [ 56 ]


2020年の米国国勢調査では、女性が人口の50.9%(1億6876万3470人)、男性が49.1%(1億6268万5811人)を占め、女性が男性より多かったと報告されています。2010年の前回の国勢調査でも、女性が男性より多かったと報告されていますが、女性が人口の50.8%とわずかに少なく、男性が49.2%とわずかに多くなっていました。[ 58 ]
女性の数が男性を上回った最初の米国国勢調査は1950年の国勢調査だった。[ 59 ]
この表では、一部の人が複数のグループに該当することに注意してください。例えば、90歳の人は「65歳以上」、「75歳以上」、「85歳以上」の3つのグループに含まれています。
出典: 米国国勢調査局、米国商務省、国連中位予測[ 61 ]

従属人口比率とは、通常労働力人口に含まれない人々(被扶養人口、0~14歳と65歳以上)と労働力人口(生産人口、15~64歳)の年齢別人口比です。これは、生産人口にかかる負担を測る指標として用いられます。扶養人口比率とは、労働年齢人口と高齢者人口の比率、すなわち高齢者従属人口比率の逆数です。

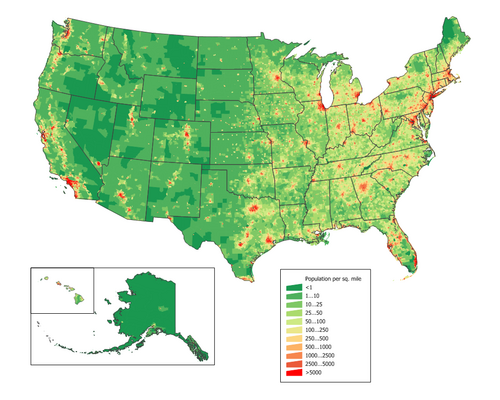


人口密度が最も高い州はニュージャージー州(1平方マイルあたり1,263人、または1平方キロメートルあたり488人)です。
人口は高度に都市化されており、人口の 83.3% が都市部や郊外に居住している。[ 7 ]大規模な都市集積地は、米国東部(特に五大湖地域、北東部、東部、南東部)と西部の州に広がっている。山岳地帯、主にロッキー山脈とアパラチア山脈、南西部の砂漠、極北部の密林、中央部の草原地帯は人口密度が低い。アラスカの人口は南海岸沿いに集中しており、特にアンカレッジ市に重点が置かれている。ハワイの人口はオアフ島に集中している。[ 7 ]カリフォルニア州とテキサス州は人口が最も多い州であり、米国の人口の平均重心は一貫して西と南に移動している。[ 64 ] [ 65 ]ニューヨーク市は米国で最も人口の多い都市であり[ 66 ] 、少なくとも 1790 年以来そうである。
米国の領土では、人口密集地としてプエルトリコのサンフアン都市圏[ 67 ]、北マリアナ諸島のサイパン[ 68 ] 、アメリカ領サモアのツツイラ島[ 69 ]などが挙げられる。

2021年時点の全人口の平均年齢は38.8歳、男性の平均年齢は37.7歳、女性の平均年齢は39.8歳である。[ 60 ]
歴史を通じての米国人口の平均年齢。出典:米国商務省国勢調査局、米国国勢調査局、ワールドファクトブック。[ 70 ] [ 71 ]
米国には数十の主要都市があり、その中にはあらゆる種類の「グローバル都市」[ 72 ]が31都市含まれ、そのうち10都市は「アルファ」グループに属するグローバル都市である。ニューヨーク、ロサンゼルス、シカゴ、ワシントンDC、ボストン、サンフランシスコ、マイアミ、フィラデルフィア、ダラス、アトランタである。[ 73 ] 2021年現在当時、米国には人口100万人以上の大都市圏が56あった。(米国国勢調査局は、ホノルル市を人口100万人強の都市圏として56位にランク付けしている。)
2011年現在約2億5000 万人のアメリカ人が都市部またはその周辺に住んでいます。つまり、アメリカの人口の4分の3以上が、アメリカの国土面積のわずか3パーセントほどの地域に居住しているということです。[ 74 ]
この表には、米国国勢調査局による年ごとの公式米国人口データと、同局の国勢調査間推計値が含まれています。これらの推計値は毎年7月1日に算出されますが、10年ごとの国勢調査実施年(2000年、2010年、2020年など)のデータは含まれていません。各数値が国勢調査によるものか、国勢調査間推計値かは明記されています。
出典: 人口、[ 75 ] [ 76 ] [ 77 ] [ 41 ]出生と死亡、[ 78 ] [ 79 ] [ 80 ] [ 81 ]合計特殊出生率、[ 82 ] [ 83 ] [ 84 ]乳児死亡率、[ 85 ] [ 86 ] [ 87 ] [ 88 ]平均寿命[ 89 ]
アメリカの人口動態における注目すべき出来事:
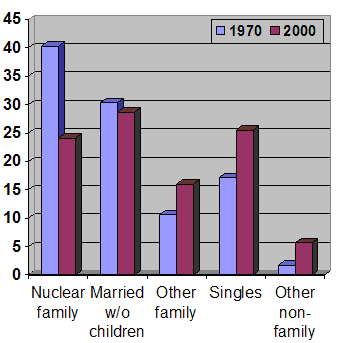

米国国勢調査局によると、2021年の米国の人口増加率は、建国以来どの年よりも低かった。[ 92 ]米国の人口は前年比わずか0.1%しか増加しなかった。[ 92 ]米国の人口増加数が100万人を下回ったのは1937年以来初めてで、国勢調査局が毎年人口推計を開始した1900年以降で最低の増加率となった。[ 92 ]過去数年間、人口増加が歴史的に低い水準に急落した時期を除けば、20世紀で最も増加率が低かったのは、インフルエンザの大流行と第一次世界大戦が真っ只中だった1918年から1919年の間だった。[ 92 ]出生率と国際移民の純増数の低下、高齢化による死亡率の上昇により、米国ではここ数年、人口増加率の鈍化が常態化している。 [ 92 ]
言い換えれば、2010年代半ば以降、出生数と国際純移民数は減少している一方で、死亡数は増加している。これらの傾向は累積的に人口増加の減少につながる。[ 92 ]
新型コロナウイルス感染症のパンデミックはこの傾向を加速させ、2021年には歴史的に見て人口増加率が鈍化した。
2021年の成長率は0.1%と推定されている。[ 92 ]
2020年時点での出生率は人口1,000人あたり11.0人です。[ 93 ]これは記録開始以来最低の出生率でした。2020年の出生数は3,613,647人で、1980年以来最低の出生数でした。[ 93 ]
2020年、CDCは2020年の結婚件数が1,676,911件であったと報告した。これは2019年の2,015,603件と比較したものである。[ 94 ]結婚率は州によって大きく異なり、カリフォルニア州の人口1,000人あたり3.2件からネバダ州の人口1,000人あたり21.0件まで幅がある。[ 95 ]
*割合は、州ごとの結婚件数の暫定的な集計に基づいています。
2009年、タイム誌は、米国での出生の40%が未婚女性によるものであると報じた。[ 96 ]未婚出産の内訳は、アジア系17%、白人29%、ヒスパニック系(人種を問わず)53%、ネイティブアメリカン66%、アフリカ系アメリカ人72%である。[ 97 ]
CDCによると、2020年には未婚女性による出産が少なくとも1,461,121件あり、これは米国の全出産の40.5%に相当する。未婚出産の内訳は、人種別に見ると、非ヒスパニック系白人が28.4%、非ヒスパニック系黒人が70.4%、ヒスパニック系(人種を問わず)が52.8%となっている。[ 98 ]
2007年から2009年にかけての米国の出生率の低下は、大不況と関連していると考えられている。[ 99 ]
医療研究品質庁(AHRQ)の調査によると、2008年と2011年の病院での出生児の半数以上(51%)が男児であった。[ 100 ]
2011 年 3 月に発表された米国連邦政府のデータによると、出生数は 2007 年から 2009 年にかけて 4% 減少しており、これは 1970 年代以降、米国における 2 年間の減少率としては最大である。[ 101 ] 出生数は 3 年連続で減少しており、現在は 2007 年のピーク時より 7% 低い。 [ 102 ] 2011 年 6 月に米国国立保健統計センターが発表したデータによると、この減少は 2010 年も続いている。[ 102 ]多くの専門家は、この減少は主に不利な経済状況を反映していると指摘している。[ 103 ]出生率と景気後退のこの関連性は、米国の出生率が現在 1930 年代の大恐慌に匹敵するレベルまで低下しているという事実に一部起因している。[ 104 ]米国の 10 代の出生率は米国史上最低水準にある。[ 105 ]実際、米国の10代の出産率は、2005年から2007年の間に一時的に増加した時期を除いて、1991年から2011年まで一貫して減少しています。[ 105 ]この10代の出産率の着実な減少傾向からのもう一つの例外は、2008年から2009年の間に15歳から19歳の出産率が6%減少したことです。[ 105 ]これらの減少の年にもかかわらず、米国の10代の出産率は依然として他の先進国よりも高いままです。[ 105 ] 10代の出産率と妊娠率にも人種差が見られます。アメリカ先住民/アラスカ先住民、ヒスパニック、非ヒスパニック系黒人の10代の妊娠率は、非ヒスパニック系白人の10代の出産率の2倍以上です。[ 106 ]

1800 年、米国人女性の平均出生数は 7.04 人でした。[ 107 ] 1900 年代の最初の 10 年間までに、この数は 3.56 に減少しました。[ 108 ] 1971 年以降、出生率は一般的に人口置換水準の 2.1 を下回っています。[ 109 ] [ 110 ] : 3 2007 年の世界金融危機以降、出生率は一貫して人口置換水準を下回っています。[ 109 ] [ 110 ] : 3 2007 年の女性 1 人当たり 2.08 から 2017 年の 1.76 への TFR の低下は、主に少数民族、10 代の若者、30 代の女性の出生率の低下によるものです。[ 111 ]その期間中、35 歳から 44 歳までの女性の出生率は上昇しました。[ 109 ] [ 111 ] 2021年第4四半期と比較して、2022年第1四半期の12か月間の総出生率は56.6から57.0に上昇した。[ 112 ]
合計特殊出生率は、女性一人当たりの出生児数です。出典:Ansley J. Coale、Zelnik、および国立健康統計センター。[ 113 ]
2020年時点の米国の合計特殊出生率は1.641である[ 93 ]。
その他: [ 52 ]
(なお、CDC(疾病対策センター)はヒスパニック系の約95%を「白人ヒスパニック」として分類しており、国勢調査の「その他の人種」という区分を認めず、その区分に該当する人々を白人としてカウントしている。)
出典: 2010年米国国勢調査データに基づく国家生命統計報告書[ 114 ]
2021年には合計3,659,289人の赤ちゃんが生まれ、2020年から1%増加しました。さらに、研究者たちは人種別の出生数も調べ、白人女性とヒスパニック系女性の出生数はそれぞれ2020年から2021年にかけて約2%増加したことを発見しました。一方、黒人女性とアジア系女性の出生数は同じ期間にそれぞれ2.4%と2.5%減少し、アメリカ先住民/アラスカ先住民女性の出生数は3.2%減少しました。[ 115 ]また、これは2014年以来初めての出生数の増加を示しています。この報告以前は、出生総数は平均して年間2%減少していました。[ 115 ]しかし、合計特殊出生率(平均的な女性が生涯に産む子供の数)は女性1人あたり1.6635人でした。これは依然として人口置換水準を下回っており、人口が自らを維持するために必要な水準は、少なくとも女性一人当たり2.1人の出生である。[ 115 ]
2024年には、米国で生まれた新生児の24.1%(873,113人)が外国生まれの母親から生まれた。[ 117 ]
注: ヒスパニック系の人々は、民族と人種の両方でカウントされるため、全体の数が多くなります。また、成長矢印は出生数の増加または減少を示しており、出生率の増加または減少を示しているわけではないことに注意してください。[ 52 ] [ 123 ] [ 124 ] [ 125 ]
鍵:


疾病対策センター(CDC)によると、2024年のアメリカ人の平均出生時寿命は79.0歳で、過去最高を記録した。[ 127 ] これは2023年の78.4歳から0.6歳増加したことになる。[ 128 ] 2021年の平均寿命は76.4歳だった。[ 129 ] : 1
Starting in 1998, life expectancy in the U.S. fell behind that of other wealthy industrialized countries, and Americans' "health disadvantage" gap has been increasing ever since.[132] Average U.S. life expectancy in the United States has actually declined in four of the years following 2014 (the year when average U.S. life expectancy reached 78.9 years, its historical peak).[133] These declines were mostly reversed in 2022 (+1.1 years), 2023 (+0.9 years), and 2024 (+0.6 years). The CDC attributed the improvement in 2024 to a significant fall in the number of fatal drug overdoses, adding that "heart disease continues to be the leading cause of death in the United States, followed by cancer and unintentional injuries."[134][135] As of 2024, death rates among the youngest in the U.S. remain well higher than in peer nations.[135] In 2023, there had already been lower death rates in each of the ten U.S. leading causes of death, with gains in life expectancy largely driven by "decreases in mortality due to COVID-19, heart disease, unintentional injuries, cancer and diabetes".[135][136]
From 2019 to 2020, the COVID-19 pandemic had contributed to approximately 61% of the decrease in life expectancy in the United States.[137] While increases in mortality from unintentional injuries, heart disease, homicide, and diabetes contributed to 11.7%, 5.8%, 2.9%, and 2.8% of the decrease in life expectancy from 2019 to 2020, respectively.[137] Life expectancy has also varied by racial and ethnic group, with Non-Hispanic Asians having the highest life expectancy and Non-Hispanic American Indians having the lowest.[137] In 2021, life expectancy at birth in the United States fell for the second year in a row, the first two-year drop since 1961–1963.[138]
NOTE: Data regarding life expectancy at birth for 2021 are provisional.*
 /
/ ) indicate an increase or decrease in total life expectancy compared to years before.
Life expectancy in the United States from 1901 to 2015. Source: Our World In Data and the United Nations.
1901–1950
1901–2015
Source: UN World Population Prospects[144]
In 2023, the U.S. Census Bureau published an updated projection of the U.S. population for 2023–2100, taking into account the results of the 2020 census. The future size and composition of the U.S. population were estimated using the cohort-component method and historical trends in fertility, mortality, and international migration.[145] The projection included a main variant and three alternative variants reflecting different international migration scenarios ("high immigration", "low immigration", and "zero immigration"), since immigration is the most uncertain component in population forecasting.[146]

The following table shows the race and ethnicity of the United States per the 1930, 1970, 2000, and 2020 censuses. Data only covers states and the federal district, thus only covering the first 48 states and Washington, D.C. in 1930 and including Alaska and Hawaii as well in 1970, 2000, and 2020. The figures thus do not include various other territories that have been under the United States during this time period.[a] Over this time period, the U.S. has changed from being 89% White, 10% Black and 1% Hispanic in 1930 to 58% White, 12% Black, and 19% Hispanic ninety years later, reflecting a significant demographic shift.
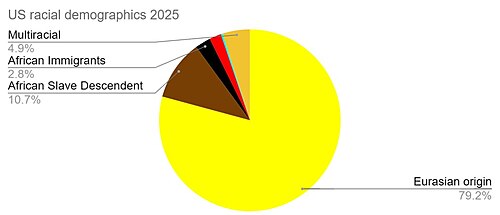


The United States Census Bureau collects racial data in accordance with guidelines provided by the U.S. Office of Management and Budget (OMB), and these data are based on self-identification. Many other countries count multiple races based on origin while America compiles multiple dozens of ethnicity groups into skin color grouping them together.[157] The racial classifications and definitions used by the U.S. Census Bureau are:[158]
Data about race and ethnicity are self-reported to the Census Bureau. Since the 2000 census, Congress has authorized people to identify themselves according to more than one racial classification by selecting more than one category. Only one ethnicity may be selected, however, because the Census Bureau recognizes only two ethnicities –"Hispanic or Latino" and "Not Hispanic or Latino" –which are mutually exclusive since you can be one or the other, but not both. The singular term Hispanic has been supplanted as a federally-recognized ethnicity by the combined "Hispanic or Latino," defined by the Census Bureau as a person of Cuban, Mexican, Puerto Rican, Cuban, South or Central American, or other Spanish culture or origin, regardless of race.[160]

According to the Census Bureau website, the racial composition of the United States in 2021 was:[161]
According to the 2022 American Community Survey, the racial composition of the United States in 2022 was:[162][163]
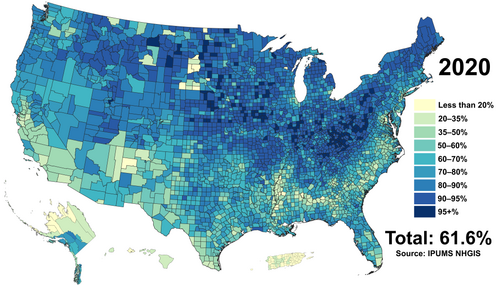
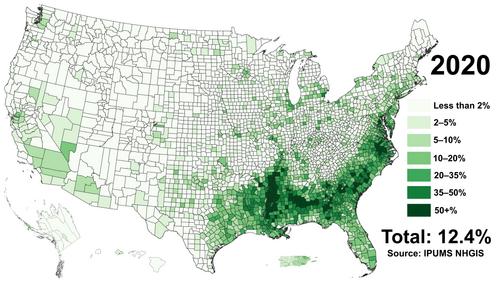
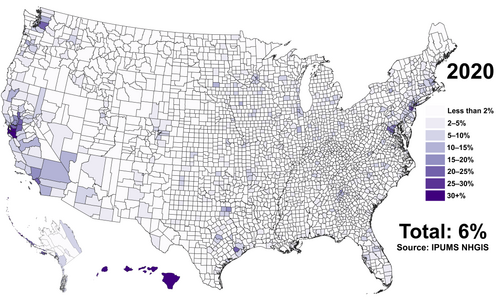

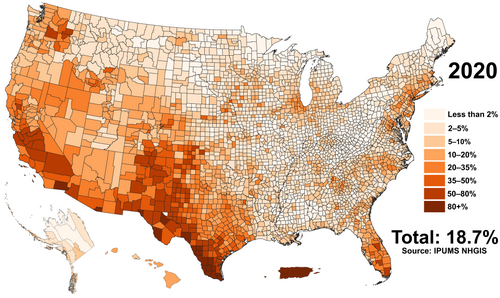
Hispanic are shown like part of the races. Source: U.S. Census Bureau.[164][71]
*Data are shown for the White, Black or African American, American Indian and Alaska Native, Asian and Native Hawaiian and Other Pacific Islander, and Some other race alone populations.
Source: United States Census Bureau.[165]
Source: United States Census Bureau.[165]

The U.S. Office of Management and Budget (OMB) defines "Hispanic or Latino" as a person of Cuban, Mexican, Puerto Rican, Dominican, South or Central American, or other Spanish culture or origin regardless of race. People who identify with the terms "Hispanic" or "Latino" are those who classify themselves in one of the specific Hispanic or Latino categories listed on the decennial census questionnaire and various Census Bureau survey questionnaires – "Mexican, Mexican Am., Chicano" or "Puerto Rican" or "Cuban" – as well as those who indicate that they are "another Hispanic, Latino, or Spanish origin".[177] People who identify their origin as Hispanic or Latino may be of any race.[158]
Source: U.S. Census Bureau, decennial census of population, 1970 (5-percent sample), 1980 to 2020.[71]
Source: United States Census Bureau.[165]
Note: Hispanic origin is considered an ethnicity, not a race. Hispanics may be of any race.
As of 2020, there are 9,666,058 people identifying as American Indian and Alaska Native people in the United States, including those identifying with more than one race,[178] representing around 3% of the U.S. population. This number includes not only groups indigenous to the United States, but any Indigenous people of the Americas,[179] including Mesoamerican peoples such as the Maya, as well as Canadian and South American natives. In 2022, 634,503 Indigenous people in the United States identified with Central American Indigenous groups, 875,183 identified with the Indigenous people of Mexico, and 47,518 identified with Canadian First Nations.[180] Of the 3.2 million Americans who identified as American Indian or Alaska Native alone in 2022, around 45% were of Hispanic or Latino ethnicity,[181][182] with this number growing as increasing numbers of Indigenous people from Latin American countries immigrate to the U.S. and more Latinos self-identify with indigenous heritage. Of groups Indigenous to the contiguous United States, the largest self-reported tribes are Cherokee (1,449,888), Navajo (434,910), Choctaw (295,373), Blackfeet (288,255), and Sioux (220,739). Additionally, 205,954 identify with an Alaska Native tribe. There are 573 federally recognized tribal governments[183] in the United States.[184]
The U.S. Census Bureau classifies Native Hawaiians separately from American Indians and Alaska Natives, grouping them with Pacific Islanders instead. According to 2022 estimates, 714,847 Americans identified with Native Hawaiian ancestry.[185]
There were 15.8 million veterans in 2023,[186] with 6.2% of Americans having served in the Armed Forces.[187] In 2023 the war with the highest number of veterans was the Korean War. Most veterans were male at 14 million and 1.7 million veterans were female.[186] Currently the veteran population in the United States is getting smaller but more diverse. The racial makeup of veterans was in 2023 as follows: 74.1% white, 12.6% African-American, 10.3% other/mixed-race, 2.2% Asian/Native Hawaiian/Pacific Islander and 0.8% being Native American.[188] Veterans have a lower poverty and unemployment than non-veterans but have higher rates of disability than non-veterans.[189]
In 2010, The Washington Post estimated that there were 11 million illegal immigrants in the country.[190] In 2017, the Pew Research Center reported an estimated 10.5 million illegal immigrants in the U.S.[191] In 2025, Pew announced that "the number of unauthorized immigrants in the United States reached an all-time high of 14 million in 2023 after two consecutive years of growth".[192]
In 2024, an estimated 1,867,404 adults were imprisoned in the United States according to the 2024 American Community Survey.[193]
In 2016 it was reported that 92.7% of all prisoners were male, 6.9% female, 0.3% transgender, and 0.1% nonbinary.[194] In 2022, there were 180,684 women incarcerated in U.S. prisons and jails. Most women involved in the country's correctional system were actually under probation, with 717,811 being so classified. Female parolees numbered 76,870, while 87,874 women were held in prisons and 92,900 women were held in jails in 2022.[195]
Some 37% of all federal prisoners were Hispanic, 32% Black/African American, 21% white, and 2% Native American or Alaska Native. Asians, Native Hawaiians and other Pacific islanders made up 2% of the population, while "nearly 7% of federal prisoners identified as two or more races". In state prisons, 34% identified as Black/African American, 32% white, 21% Hispanic, 1% Native American or Alaskan Native, 1% as being either Asian/Native Hawaiian/Other Pacific Islander, and 11% "identified with two or more races".[194]
The United States Census Bureau does not measure sexual orientation but plans are in place to start measuring it starting in 2027 with the American Community Survey.[196] In 2024, Gallup reported that 9.3% of adults were LGBTQ. The percentage of people who have reported being LGBTQ has risen during the 2010s and 2020s. Of LGBTQ adults in the United States, the most common identification was bisexual, with 56.3% of LGBTQ adults identifying as bisexual; bisexual people made up 5.2% of the adult U.S. population. The survey also reported that 13.9% of LGBTQ adults were transgender and made up 1.3% of the U.S. adult population.[197]
In the 2020 United States Census, there were more reported same-sex married couples than unmarried ones as there were 668,497 married same-sex couples and 500,073 unmarried same-sex couples.[198]
In June 2023, UCLA's Williams Institute reported that there were approximately 823,000 same-sex couples in the United States. Also according to the institute, most same-sex couples were female at 53% and males were 47% of same-sex couples.[199]
A report by the U.S. Census Bureauprojects a decrease in the ratio of non-Hispanic Whites between 2023 and 2060, a decline from 58.9% of the population to 44.9%. Non-Hispanic Whites are projected to no longer make up a majority of the population by 2050, but will remain the largest single ethnic group. Non-Hispanic whites made up 85% of the population in 1960.[201]
While non-Hispanic whites are projected to become a minority, the total White population (including Hispanics), will remain a majority from 2023 to 2060, falling from 75.5% to 72.3% of the population who are white alone according to the projections.[202] However, these projections are not directly comparable to other Census Bureau data, as they are based on a modified race dataset,[203] which does not include the "some other race" category used in census surveys.[204] Individuals identifying as “some other race” alone or in combination made up 16.2% of the population in 2022,[205] and they are reclassified into recognized race categories in the dataset used for the projections.[206] As a result, there is a significant discrepancy between the share of the white alone population in 2023 according to the projections (75.5%), and the estimated share of white alone (60.9%), as reported by the American Community Survey in 2022.[207]
The report foresees the Hispanic or Latino population rising from 19.1% today to 26.9% by 2060, the Black percentage barely rising from 13.6% to 14.8%, and Asian Americans upping their 6.3% share to 9.4%. The United States had a population of 333 million people in July 2023, and is projected to reach 355 million by 2040 and 364 million in 2060.[208][209][210][211][212] It is further projected that all of the increase in population from 2023 to 2060 will be due to immigrants.
Of the nation's children in 2060, 64% are expected to be of a minority ethnicity, up from 51% today. Approximately 32% are projected to be Hispanic or Latino (up from 26% in 2023), and 36% are projected to be single-race, non-Hispanic Whites (down from 49% in 2023). Racial and ethnic minorities surpassed non-Hispanic whites as the largest group of U.S. children under 5 years old in 2015.[213]
The fastest growing racial group in America is Asian Americans with a growth rate of 35%, however the multiracial mixed Asian group is growing even faster, with a growth rate of 55%. Multiracial Asians are therefore the fastest growing demographic group in America.[39][38]
In 2020, it was reported that 51.0% of births were to non-Hispanic white mothers.[114] In 2021, the percentage increased to 51.5%.[114][214] However, by 2022 the rate of births to white mothers had declined by 3%, dropping to 50% of all total births. In the same period, the rate of births to Asian and Hispanic women increased by 2% and 6%, respectively.[215] In the same time period, births to Asian American and Hispanic women increased by 2% and 6%, respectively.[216]


The United Nations projects a population of just over 400 million in 2060.
The country's racial profile will be vastly different, and although whites will remain the single largest ethnic group in the U.S., they will no longer be a majority excluding White Hispanics by 2055 according to Pew Research Center. Growth in the Hispanic and Asian populations is predicted to almost triple over the next 40 years. By 2055, the breakdown is estimated to be 48% non-Hispanic white, 24% Hispanic, 16% Black, and 14% Asian.[218]
As of 2015, 14% of the United States' population is foreign born, compared to just 5% in 1965. Nearly 39 million immigrants have come to the U.S. since 1965, with most coming from Asia and Latin America. The 2015 Census Report predicts that the percentage of the U.S. population that is foreign-born will continue to increase, reaching 19% by 2060. This increase in the foreign-born population will account for a large share of the overall population growth.[218]
The average person in the U.S. of 2060 is likely to be older than the average person of 2018 today, and it is projected that almost one in four people will be 65 or older.[218]
Note: "Minority" refers to people who reported their ethnicity and race as something other than non-Hispanic White alone in the decennial census.

This table displays all self-reported ancestries with over 10,000 members according to estimates from the 2026 American Community Survey.
The table below is based mainly on selected data as reported to the United States Census Bureau. It only includes the voluntary self-reported membership of religious bodies with 750,000 or more. The definition of a member is determined by each religious body.[221]In 2004, the US census bureau reported that about 13% of the population did not identify themselves as a member of any religion.[222]
According to data from Pew Research, Americans are significantly more religious on average than populations in other developed Western nations, with 55% of Americans reporting praying daily, compared to only 25% of Canadians, 18% of Australians, 6% of British people, and 22% of Europeans as a whole.[223] The country has a smaller share of unaffiliated or atheist population than most other Western nations. However, this population has been growing significantly in recent decades. Surveys conducted in 2014 and 2019 by Pew indicated that the percentage of Americans unaffiliated with a religion increased from 16% in 2007 to 23% in 2014 and 26% of the population in 2019.[224][225] A Pew Research Survey performed in 2012 found that the number of Americans without a religion was approaching the number of Evangelical Protestants, and estimated that if the current growth rate in irreligion continued, around 51% of Americans will not have a religion by 2050.[226]
According to statistical data made by the Pew Research Center in 2023 about 62% of the US population is Christian, 29% is Unaffiliated, 2% is Jewish, 1% follows Buddhism, 1% follows Hinduism, 1% follows Islam and 3% follow traditional religions and others.[227] Currently, the United States has the largest Christian population in the world (approximately 210 million) and the largest Protestant Christian population (approximately 130 million). The country also has the second largest Jewish community in the world (after Israel) and the largest Buddhist and Hindu communities in the West, as well as the largest number of followers of Islam in North America. The country has about 99 million non-affiliates (only China and Japan have more).


According to Pew Research Center study released in 2018, by 2040, Islam will surpass Judaism to become the second largest religion in the US due to higher immigration and birth rates.[253]
The United States government does not collect religious data in its census. The survey below, the American Religious Identification Survey (ARIS) 2008, was a random digit-dialed telephone survey of 54,461 American residential households in the contiguous United States. The 1990 sample size was 113,723; 2001 sample size was 50,281.
Adult respondents were asked the open-ended question, "What is your religion, if any?". Interviewers did not prompt or offer a suggested list of potential answers. The religion of the spouse or partner was also asked. If the initial answer was "Protestant" or "Christian" further questions were asked to probe which particular denomination. About one-third of the sample was asked more detailed demographic questions.
Religious Self-Identification of the U.S. Adult Population: 1990, 2001, 2008[254]Figures are not adjusted for refusals to reply; investigators suspect refusals are possibly more representative of "no religion" than any other group.


As of 2017, an estimated 44,525,458 residents of the United States were foreign-born,[257] 13.5% of the country's total population. This demographic includes recent as well as longstanding immigrants; statistically Europeans have resided in the US longer than those from other regions with approximately 66% having arrived prior to 2000.[258]
In 2017, out of the U.S. foreign-born population, some 45% (20.7 million) were naturalized citizens, 27% (12.3 million) were lawful permanent residents (including many eligible to become citizens), 6% (2.2 million) were temporary lawful residents, and 23% (10.5 million) were unauthorized immigrants.[260] The Pew Research Center estimated that "the number of unauthorized immigrants in the United States reached an all-time high of 14 million in 2023 after two consecutive years of growth".[261]
Among current living immigrants to the U.S., the top five countries of birth are Mexico (25% of immigrants), China (6%), India (6%), the Philippines (5%) and El Salvador (3%). Some 13% of current living immigrants come from Europe and Canada, and 10% from the Caribbean.[260] Among new arrivals, Asian immigrants have been more numerous than Hispanic immigrants since 2010; in 2017, 37.4% of immigrant arrivals were Asian, and 26.6% were Hispanic.[260] Until 2017 and 2018, the United States led the world in refugee resettlement for decades, admitting more refugees than the rest of the world combined.[262] From fiscal year 1980 until 2017, 55% of refugees came from Asia, 27% from Europe, 13% from Africa, and 4% from Latin America, fleeing war and persecution.[262]
*(mid-year estimates)
As of 2017, 13.6% (44.4 million) of the population was foreign-born – an increase from 4.7% in 1970 but less than the 1890 record of 14.8%. Some 45% of the foreign-born population were naturalized US citizens. Around 23% (10.3 million) of the foreign-born community is undocumented, accounting for 3.2% of the total population.[260] According to the 2010 census, Latin America and the Caribbean is the largest region-of-birth group, accounting for 53% of the foreign-born population. As of 2018, this region is still the largest source of immigrants to the United States.[264][265][266] In 2018, there were almost 90 million immigrants and U.S. born children of immigrants (second-generation Americans) in the United States, accounting for 28% of the overall U.S. population.[267] In 2018, 1,096,611 immigrants were granted either permanent or temporary legal residence in the United States[268]
As of April 2015, the U.S. State Department estimated that 8.7 million American citizens live overseas. Americans living abroad are not counted in the U.S. Census unless they are federal government employees or dependents of a federal employee.[271] A 2010 paper estimated the number of civilian Americans living abroad to be around 4 million.[272] So-called "accidental Americans" are citizens of a country other than the United States who may also be considered U.S. citizens or be eligible for U.S. citizenship under specific laws but are not aware of having such status (or became aware of it only recently).[273]
As of 2022, 1.6 million Americans live in Mexico, according to the State Department.[274]
In 2020, the median household income in the United States was around $67,521, 2.9 percent less than the 2019 median of $69,560.[275] Household and personal income depends on variables such as race, number of income earners, educational attainment and marital status.


Social classes in the United States lack distinct boundaries and may overlap. Even their existence (when distinguished from economic strata) is controversial. The following table provides a summary of some prominent academic theories on the stratification of American society:

The U6 unemployment rate as of April 2017 was 8.6 percent.[286] The U6 unemployment rate counts not only people without work seeking full-time employment (the more familiar U3 rate), but also counts "marginally attached workers and those working part-time for economic reasons". Some of these part-time workers counted as employed by U6 could be working as little as an hour a week. And the "marginally attached workers" include those who have become discouraged and stopped looking, but still want to work. The age considered for this calculation is 16 years and over.
Urban Americans have more job opportunities than those in more rural areas. From 2008 to 2018, 72% of the nation's employment growth occurred in cities with more than one million residents, which account for 56% of the overall population.[287]

A definitive recent study of U.S. generational cohorts was done by Schuman and Scott (2012) in which a broad sample of adults of all ages was asked, "What world events are especially important to you?"[288] They found that 33 events were mentioned with great frequency. When the ages of the respondents were correlated with the expressed importance rankings, seven (some indicated eight or nine) distinct cohorts became evident.
Today the following descriptors are frequently used for these cohorts:
Subdivided groups are present when peak boom years or inverted peak bust years are present, and may be represented by a normal or inverted bell-shaped curve (rather than a straight curve). The boom subdivided cohorts may be considered as "pre-peak" (including peak year) and "post-peak". The year 1957 was the baby boom peak with 4.3 million births and 122.7 fertility rate. Although post-peak births (such as trailing edge boomers) are in decline, and sometimes referred to as a "bust", there are still a relatively large number of births. The dearth-in-birth bust cohorts include those up to the valley birth year, and those including and beyond, leading up to the subsequent normal birth rate. The baby boom began around 1943 to 1946.[297]
From the decline in U.S. birth rates starting in 1958 and the introduction of the birth control pill in 1960, the Baby Boomer normal distribution curve is negatively skewed. The trend in birth rates from 1958 to 1961 show a tendency to end late in the decade at approximately 1969, thus returning to levels prior to World War II, with 12 years of rising and 12 years of declining birth rates. Pre-war birth rates were defined as anywhere between 1939 and 1941 by demographers such as the Taeuber's, Philip M. Hauser and William Fielding Ogburn.[298]
In 2021, 27.1 million Americans said they were living in a different place than a year before, compared to 29.8 million in 2020. This reflects an 8.4% mover rate, the lowest recorded in more than 70 years.[299]
In 2022 the most common level of highest educational attainment among those 25 years old and up (who were civilian and not institutionalized) was completing high school.[300]
According to the 2020 United States Census, the country had a total of 140,498,736 housing units, of which 126,817,580 (90.3%) were occupied and 13,681,156 (9.7%) were classified as being vacant, irrespective of status ("for rent", "rented, not occupied", "for sale only", "sold, not occupied", "for seasonal, recreational, or occasional use", among others). Of the occupied units, 80,051,358 units (63.1%) were owner-occupied, while 46,766,222 units (36.9%) were occupied by tenants.[301]
In the 2024 1-year American Community Survey the median number of rooms in a housing unit was 5.5 with the most common amount of rooms for a housing unit being 5 per unit.[302] Homes have more excess bedrooms (bedrooms which are not occupied) than in the past compared to 1970 and 1980 but home sizes on average have decreased since the 2010s.[303] It was also reported in the 2024 survey that among occupied housing units the most common fuel for heating was "Utility gas".[302]
For reference, the 5-year ACS estimate is taken every year is collected for all areas regardless of population over a 5-year period compared to the 1-year estimates which are collected within a year and only cover areas with a population at or over 65,000+ people.[310]
A plurality of housing units were built in the 1970s according to 2024 1-year American Community Survey and the 5-year survey.[302][318] Data is as of the 2024 1-year American Community Survey. Table source:[302]
This table only looks at occupied housing units and this table shows results from the 1-year American Community Survey. No data is available for 2020.
This table looks at the number of housing units with phone service in them. Data in this table comes from the 1-year American Community Survey.
{{cite web}}: CS1 maint: url-status (link){{cite web}}: CS1 maint: url-status (link){{cite journal}}: CS1 maint: url-status (link){{cite web}}: CS1 maint: url-status (link){{cite journal}}: CS1 maint: multiple names: authors list (link){{cite web}}: CS1 maint: url-status (link){{cite web}}: CS1 maint: url-status (link){{cite web}}: CS1 maint: url-status (link)The Federal Voting Assistance Program (FVAP) estimates that there are 4.5 million to 6.5 million overseas Americans while the State Department's most recent calculation (April 2015) of US citizens living overseas is 8.7 million{...}US citizens living outside the US who are not employed by the US Government, including dependents living with them – Not counted in the census.
{{cite web}}: CS1 maint: url-status (link){{cite web}}: CS1 maint: url-status (link)