
Loading article…

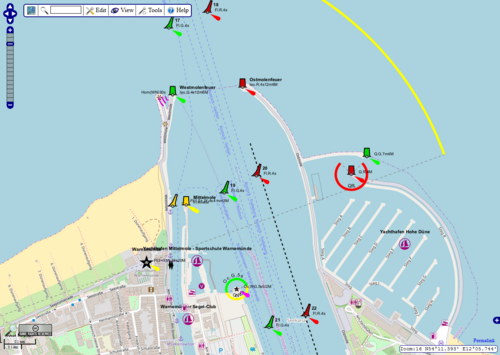
海図または水路図は、海域または水域と隣接する海岸線または砂州を図示したものです。海図の縮尺に応じて、水深(水深測量)と陸地の高さ(地形)、海底の自然地形、海岸線の詳細、航行上の危険、自然および人工の航行援助施設の位置、潮汐と海流に関する情報、地球の磁場の局所的な詳細、港、建物、橋などの人工構造物などが表示されます。海図は海上航行に不可欠なツールであり、多くの国では船舶、特に商船に海図の搭載を義務付けています。海図は、紙に印刷された海図(ラスター海図)またはコンピュータ化された電子海図の形式をとります。最近の技術では、印刷前夜に商業印刷会社にダウンロードされた地図データを使用して「オンデマンド」で印刷される紙海図が利用可能になっています。毎日ダウンロードされるデータには、航海通報などの重要なデータがオンデマンドの海図ファイルに追加されるため、印刷時には海図が最新の状態に保たれます。
海図は、水路測量と水深測量に基づいて作成されます。測量は労力と時間がかかるため、多くの海域の水路データは古くなっている場合があり、信頼性に欠けることもあります。水深はさまざまな方法で測定されます。歴史的には測深線が使用されていました。現代では、外洋の海底を測定するために音響測深が使用されています。難破船などの障害物全体の安全な水深を測定する場合、水平なワイヤーでその領域を掃引して最小水深を確認します。海図上のすべての水深は、基準面/参照レベルを基準として測定されます。これにより、マストなどの見つけにくい突起物が、障害物の上を航行する船舶にとって危険にならないことが保証されます。

海図は、多くの国で国立水路局の権限によって発行されています。これらの海図は、商業出版社が作成した海図とは対照的に「公式」とみなされています。多くの水路局は、販売代理店を通じて、海図の定期的な(時には毎週の)手動更新を提供しています。各水路局は、国内海図シリーズと国際海図シリーズを作成しています。国際水路機関によって調整される国際海図シリーズは、可能な限り多くの海図システムを統一することを目的として開発されている、世界的な海図システム(「INT」海図シリーズ)です。
市販の海図もあり、中にはヨットの船長などにとって特に役立つ追加情報が掲載されているものもある。
海図に描かれた水路の性質は変化する可能性があり、航行のための人工的な補助施設も予告なしに変更される可能性があります。したがって、古い海図や修正されていない海図を航行に使用してはなりません。海図を作成するすべての企業は、海図に影響を与える変更を航海者に知らせるシステムも提供しています。米国では、海図の修正や新版の通知は、さまざまな政府機関によって、航海通報、地方航海通報、修正概要、および航海通報放送を通じて提供されます。米国では、NOAAは「POD」(オンデマンド印刷)NOAA海図を印刷する印刷パートナーも持っており、印刷時点での最新の修正と通知が含まれています。航海者に通知するために、無線放送は緊急の修正を事前に通知します。
修正事項を管理する良い方法は、海図・刊行物修正記録カードシステムを使用することです。このシステムでは、航海士は新しい航海通報が届いても、ポートフォリオ内のすべての海図をすぐに更新するのではなく、各海図ごとにカードを作成し、そのカードに修正内容を記録します。海図を使用する際には、海図とカードを取り出し、海図に示された修正を行います。このシステムにより、すべての海図が使用前に適切に修正されていることが保証されます。慎重な航海士は、修正事項を記録しておらず、海図が数か月以上経過している場合は、新しい海図を入手すべきです。
Digitrace、Voyager、ChartCoなど、さまざまなデジタル航海通報システムが市販されており、英国海軍水路部発行の海図やNOAA(米国海洋大気庁)発行の海図を修正できます。これらのシステムは、船舶に関連する修正情報のみを電子メールまたはウェブダウンロードで提供し、各海図の修正作業にかかる時間を短縮します。修正作業を支援するためのトレース図も同時に提供されます。
The Canadian Coast Guard produces the Notice to Mariners publication which informs mariners of important navigational safety matters affecting Canadian Waters. This electronic publication is published on a monthly basis and can be downloaded from the Notices to Mariners (NOTMAR) Web site. The information in the Notice to Mariners is formatted to simplify the correction of paper charts and navigational publications.
Various and diverse methods exist for the correction of electronic navigational charts.
In 1973 the cargo ship MV Muirfield (a merchant vessel named after Muirfield, Scotland) struck an unknown object in the Indian Ocean in waters charted at a depth of greater than 5,000 metres (16,404 ft), resulting in extensive damage to her keel.[1] In 1983, HMAS Moresby, a Royal Australian Navysurvey ship, surveyed the area where Muirfield was damaged, and charted in detail a previously unsuspected hazard to navigation, the Muirfield Seamount. The dramatic accidental discovery of the Muirfield Seamount is often cited as an example of limitations in the vertical geodetic datum accuracy of some offshore areas as represented on nautical charts, especially on small-scale charts.
A similar incident involving a passenger ship occurred in 1992 when the Cunard liner Queen Elizabeth 2 struck a submerged rock off Block Island in the Atlantic Ocean.[2] In November 1999, the semi-submersible, heavy-lift shipMighty Servant 2 capsized and sank after hitting an uncharted single underwater isolated pinnacle of granite off Indonesia. Five crew members died and Mighty Servant 2 was declared a total loss.[3] More recently, in 2005 the submarine USS San Francisco ran into an uncharted seamount (sea mountain) about 560 kilometres (350 statute miles) south of Guam at a speed of 35 knots (40.3 mph; 64.8 km/h), sustaining serious damage and killing one seaman. In September 2006 the jack-up bargeOctopus ran aground on an uncharted sea mount within the Orkney Islands (United Kingdom) while being towed by the tug Harold. £1M worth of damage was caused to the barge and delayed work on the installation of a tidal energy generator prototype. As stated in the Mariners Handbook and subsequent accident report: "No chart is infallible. Every chart is liable to be incomplete".[4]

Historically the first projection, invented by Marinus of Tyre ca. AD 100 according to Ptolemy, was what is now called equirectangular projection (historically called plane chart, plate carrée, Portuguese: carta plana quadrada). While it is very convenient for small seas like the Aegean, it is unsuitable for seas larger than Mediterranean or an open ocean, even though early explorers had to use it for want of a better.
現在、ほとんどの海図でメルカトル図法が使用されています。メルカトル図法は正角図法、つまり海図上の方位が自然界の対応する角度と一致するため、海図上にプロットされた航路をそのまま操舵針路として使用できます。
グノモン投影法は、大圏航路の作図を目的とした海図に使用されます。NOAAは、五大湖の海図の一部に、大小両方の縮尺で多円錐投影法を使用しています。 [ 5 ]
海図に示されている場所の位置は、WGS 84などの測地基準系を基準として、海図の境界にある経度と緯度の目盛りから測定できます。
方位とは、2つの対象地点を結ぶ線と、一方の地点から北方向(例えば、船の航路や羅針盤が示すランドマーク)へ伸びる線との間の角度のことです。海図では、羅針盤が指す磁北ではなく、常に真北が上になります。ほとんどの海図には、磁北と真北の差を示す羅針盤図が描かれています。
しかし、メルカトル図法には欠点があります。この図法では経線が平行に描かれています。実際の地球では、経線は北極または南極に近づくにつれて収束します。つまり、高緯度では東西方向の距離が誇張されます。投影の正角性を保つために、この図法では緯線間の距離(南北方向の距離)を比例して大きく表示します。そのため、正方形は海図上のどこでも正方形として表示されますが、北極圏の正方形は赤道上の同じ大きさの正方形よりもはるかに大きく表示されます。実際には、これは思ったほど問題ではありません。緯度1分は、実際には1海里に相当します。したがって、海図の側面に印刷されている緯度目盛りで距離を海里単位で測定できます。[ 6 ]

Conventional nautical charts are printed on large sheets of paper at a variety of scales. Mariners will generally carry many charts to provide sufficient detail for the areas they might need to visit. Electronic navigational charts, which use computer software and electronic databases to provide navigation information, can augment or in some cases replace paper charts, though many mariners carry paper charts as a backup in case the electronic charting system fails.
Many countries' hydrographic agencies publish a "Chart 1", which explains all of the symbols, terms and abbreviations used on charts that they produce for both domestic and international use. Each country starts with the base symbology specified in IHO standard INT 1, and is then permitted to add its own supplemental symbologies to its domestic charts, which are also explained in its version of Chart 1. Ships are typically required to carry copies of Chart 1 with their paper charts.
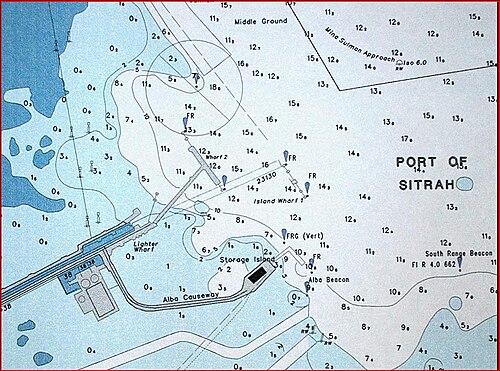
Nautical charts must be labeled with navigational and depth information. There are a few commercial software packages that do automatic label placement for any kind of map or chart. Modern systems render electronic charts consistent with the IHO S-52 specification, issued by the International Hydrographic Organization (IHO).[7]

The chart uses symbols to provide pilotage information about the nature and position of features useful to navigators, such as sea bed information, sea mark, and landmarks. Some symbols describe the sea bed with information such as its depth, materials as well as possible navigational hazards such as shipwrecks. Other symbols show the position and characteristics of navigational aids such as buoys, lights, lighthouses, coastal and land features and structures that are useful for position fixing. The abbreviation "ED" is commonly used to label geographic locations whose existence is doubtful.
Colours distinguish between human-made features, dry land, sea bed that dries with the tide, and seabed that is permanently underwater and indicate water depth.
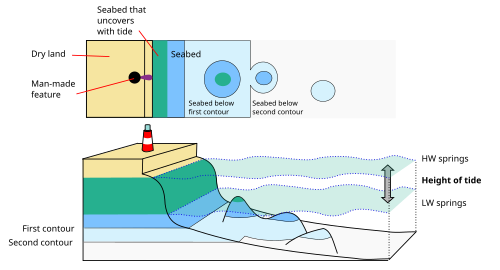
測定された水深は、海図に示されている数値で示されます。世界のほとんどの地域で発行されている海図の水深はメートルで表されます。古い海図や米国政府が発行した海図では、フィートやファゾムが使用されている場合があります。等深線は、海底地形の形状を示します。色分けされた海域は、浅瀬や危険な水中障害物を強調しています。水深は、現地の海面に関連する海図基準面から測定されます。海図基準面は、各国の水路局が使用する基準によって異なります。一般的には、全潮汐サイクルで予測される最低潮位である最低天文潮位(LAT) を使用する傾向がありますが、非潮汐域および一部の潮汐域では平均海面(MSL) が使用されます。
灯台などの高さは、一般的に平均満潮位(MHWS)を基準として示されます。橋やケーブルの下などの垂直方向のクリアランスは、最高天文潮位(HAT)を基準として示されます。海図には、使用されている基準面が明記されています。
高さを表すのにHAT、水深を表すのにLATを使用することで、航海士は海図を素早く確認して、障害物を通過するのに十分な余裕があることを確認できます。ただし、安全を確保するためには潮位を計算する必要がある場合もあります。
潮汐の速い流れや強い潮流には、特別な海図記号が用いられます。潮汐の流れに関する情報は、潮汐菱形を用いて海図上に表示されることがあり、これは潮汐周期の各時間における潮汐の流れの速度と方位を示します。